A GitOps-delivered microservices platform, built and operated with production discipline.

MicroTodoSuite is a five-service distributed system delivered through a fully automated, digest-pinned, signature-verified GitOps pipeline onto AWS EKS. This is a record of the architecture decisions behind it, the security and delivery mechanics that carry every change into a cluster, and verifiable evidence of the platform's current state.

What MicroTodoSuite is, and what it was built to demonstrate

A distributed to-do application used as a vehicle to engineer a real platform: multiple languages, one contract, one delivery mechanism, and a security and observability posture that holds regardless of which service is changing.

Five independently owned services

Each service is a separate repository with its own release cadence, contract tests, and CI caller, coordinated only through published API contracts and a shared delivery mechanism — never through shared code or a shared deploy step.

  • auth-api — Go, JWT issuance
  • todos-api — Node.js, todo domain, Redis-backed events
  • users-api — Java 17 / Spring Boot 3
  • log-message-processor — Python, Redis stream consumer
  • frontend — Vue 3

One organization, seven repositories

Application code, delivery mechanism, infrastructure, shared CI/CD, and documentation are deliberately split so that each has its own review ownership and blast radius.

  • microservice-app-gitops — ArgoCD source of truth
  • microservice-app-ops — Terraform-managed AWS infrastructure
  • .github — reusable, SHA-pinned CI/CD workflows
  • microservice-app-docs — architecture decisions and status
  • microservice-app-slack-approval-gateway — human-in-the-loop gate

Spec-driven, not vibe-driven

Every non-trivial change starts as a written specification — problem statement, acceptance scenarios, and a task breakdown — reviewed before implementation begins, and traced back to it in the pull request that closes it.

  • spec.md — problem and acceptance criteria
  • plan.md — technical approach and trade-offs
  • tasks.md — traceable, individually verifiable units of work

The decisions that shaped the platform, and why they were made

Each record below states the problem being solved, the options that were on the table, what was chosen, and the reasoning — not the order in which the work happened.

01

Two architecture profiles: economical and full

active decision

Rather than design one architecture and scale it up later, the platform was specified as two explicit profiles from the start, so that the cost/complexity trade-off is a deliberate, documented choice rather than an accident of what got built first.

DimensionEconomical profileFull profile
Cluster topology1 EKS cluster, namespaces as environments3 dedicated EKS clusters (dev/staging/prod)
Service meshNone — direct in-cluster networkingIstio mesh, mTLS between services
Log/search backendLokiECK-managed Elasticsearch
Monthly cost profileLow — single control plane, small nodesHigh — three control planes, mesh sidecars, ECK
Statuslivelive

Both profiles have run end to end. The economical profile was validated on 2026-09-14, quiesced the next day on cost discipline, and has been brought back online since 2026-09-21. The full profile's AWS foundations were applied the same day (2026-09-14) and re-upped on 2026-09-21; ArgoCD is bootstrapped and verified healthy on all three dedicated clusters (fdev/fstg/fprd) as of 2026-09-22 — every capability it adds (mesh, per-environment isolation, ECK) ships with test coverage in addition to that infrastructure now standing.

Platform overview: both profiles, the recovery domain, and the delivery path from GitHub through GitOps to every cluster

Fig. 1 — both profiles side by side, the shared/durable AWS resources, and the Azure recovery domain production would fail over to. Click to open full size.

02

Build once, promote by immutable digest

active decision

Problem

Rebuilding an image per environment risks promoting something that was never actually tested — a dev build and a prod build of "the same" tag can differ.

Decision

An image is built exactly once per change, scanned, signed, and referenced everywhere after that by its SHA-256 digest — never by a mutable tag. Promotion is a Kustomize overlay update pointing to that same digest in the next environment.

03

GitOps discipline: git revert as the only rollback path

active decision

Problem

Imperative kubectl patch/scale fixes drift from what's in Git, and the next reconciliation silently reverts a hand-applied fix — a classic GitOps failure mode.

Decision

No hand-applied mutation to managed state. A correction is a commit; a rollback is a git revert. The single documented exception is an audited bootstrap boundary for standing up ArgoCD itself, which cannot reconcile before it exists.

Sequence diagram: rollback as a git revert, ArgoCD detecting OutOfSync and reapplying the previous digest

Fig. 2 — there is no rollback button and no kubectl step: undoing a release is undoing a commit. Click to open full size.


The economical profile, as it was actually deployed

One EKS cluster, ArgoCD-reconciled, with namespaces standing in for environments and every dependency declared as a Kustomize root ArgoCD owns.

The five services and how they call each other inside one environment's namespace, with ports as deployed

Fig. 3 — the five services inside one environment's namespace: who calls whom, over which port, and what nothing keeps durable. Click to open full size.

Economical profile: one EKS cluster serving four isolated environments, its VPC, subnets, load balancer, and ArgoCD-owned add-ons

Fig. 4 — the real AWS layout: one EKS cluster, three availability zones, one shared Application Load Balancer, four namespace-environments. Validated 2026-09-14. Click to open full size.

Namespace isolation: how one EKS cluster keeps four environments apart via NetworkPolicy, ResourceQuota, Role and SecretStore

Fig. 5 — how a single cluster still keeps four environments apart: default-deny NetworkPolicy, per-namespace quotas, and IRSA-scoped secret access, all identical across environments. Click to open full size.

The full profile trades that single cluster for three isolated ones, a real service mesh, and an Azure recovery domain for production — built to the same level of detail, and now standing:

Full profile: three isolated AWS environments behind a centralized egress hub, with an Azure AKS recovery domain for production

Fig. 6 — three isolated clusters behind a centralized egress hub, Istio with strict mTLS in each, and an AKS warm standby for production. Contract-tested and applied to real infrastructure. Click to open full size.


From a merged pull request to a running, verified digest

One reusable pipeline definition, pinned by commit SHA, called by a thin per-service caller workflow — so every service inherits the same security and promotion behavior without re-implementing it.

build
unit + contract tests
Trivy scan
Syft SBOM
Cosign sign (keyless)
push to ECR
promote/* PR (digest bump)
human review
ArgoCD sync
Kyverno verify

Reusable workflow set (.github)

  • ci.yml — build, unit and contract tests, static analysis
  • release.yml — scan, SBOM, sign, publish to ECR
  • promote.yml — opens the digest-bump pull request into gitops
  • stack-tests.yml — integration/E2E against the composed stack

Every per-service caller pins these by commit SHA, not by tag or branch — a compromised or force-pushed upstream workflow cannot silently change what runs in a service's pipeline.

Authentication: OIDC only

No static AWS or registry credential is stored anywhere in CI. Every job that needs AWS access requests a short-lived token via GitHub's OIDC identity provider, scoped to that repository and workflow by an IAM trust policy.

  • GitHub Apps provide the automation identity for cross-repo actions (opening promotion PRs, merging via Slack) — never a personal access token.
  • Terraform ephemeral write-only variables (*_wo) carry secrets through a single plan/apply invocation and are never written to state.
Delivery pipeline from a pull request to a production canary: one image, built once, promoted by digest

Fig. 7 — from a pull request to a production canary: one image, built once, promoted by digest through dev, staging and a human-gated prod. Click to open full size.

Sequence diagram: a digest reaching production through independent signature verification, a digest-only rewrite, and a human-reviewed pull request per environment

Fig. 8 — promotion never rebuilds and never moves a tag: one pull request per environment changes exactly one overlay's digest, and production waits for a human. Click to open full size.

Sequence diagram: the production canary gated by an Argo Rollouts AnalysisRun querying the real Prometheus error ratio

Fig. 9 — the production canary decides for itself: Argo Rollouts shifts traffic in steps, gated by an AnalysisRun that queries real Prometheus error rate, not a synthetic probe. Click to open full size.

Evidence: the pipeline, running

Screenshots taken directly from the running GitHub Actions, Slack, and GitOps pull request surfaces — not staged, not rendered for this page.

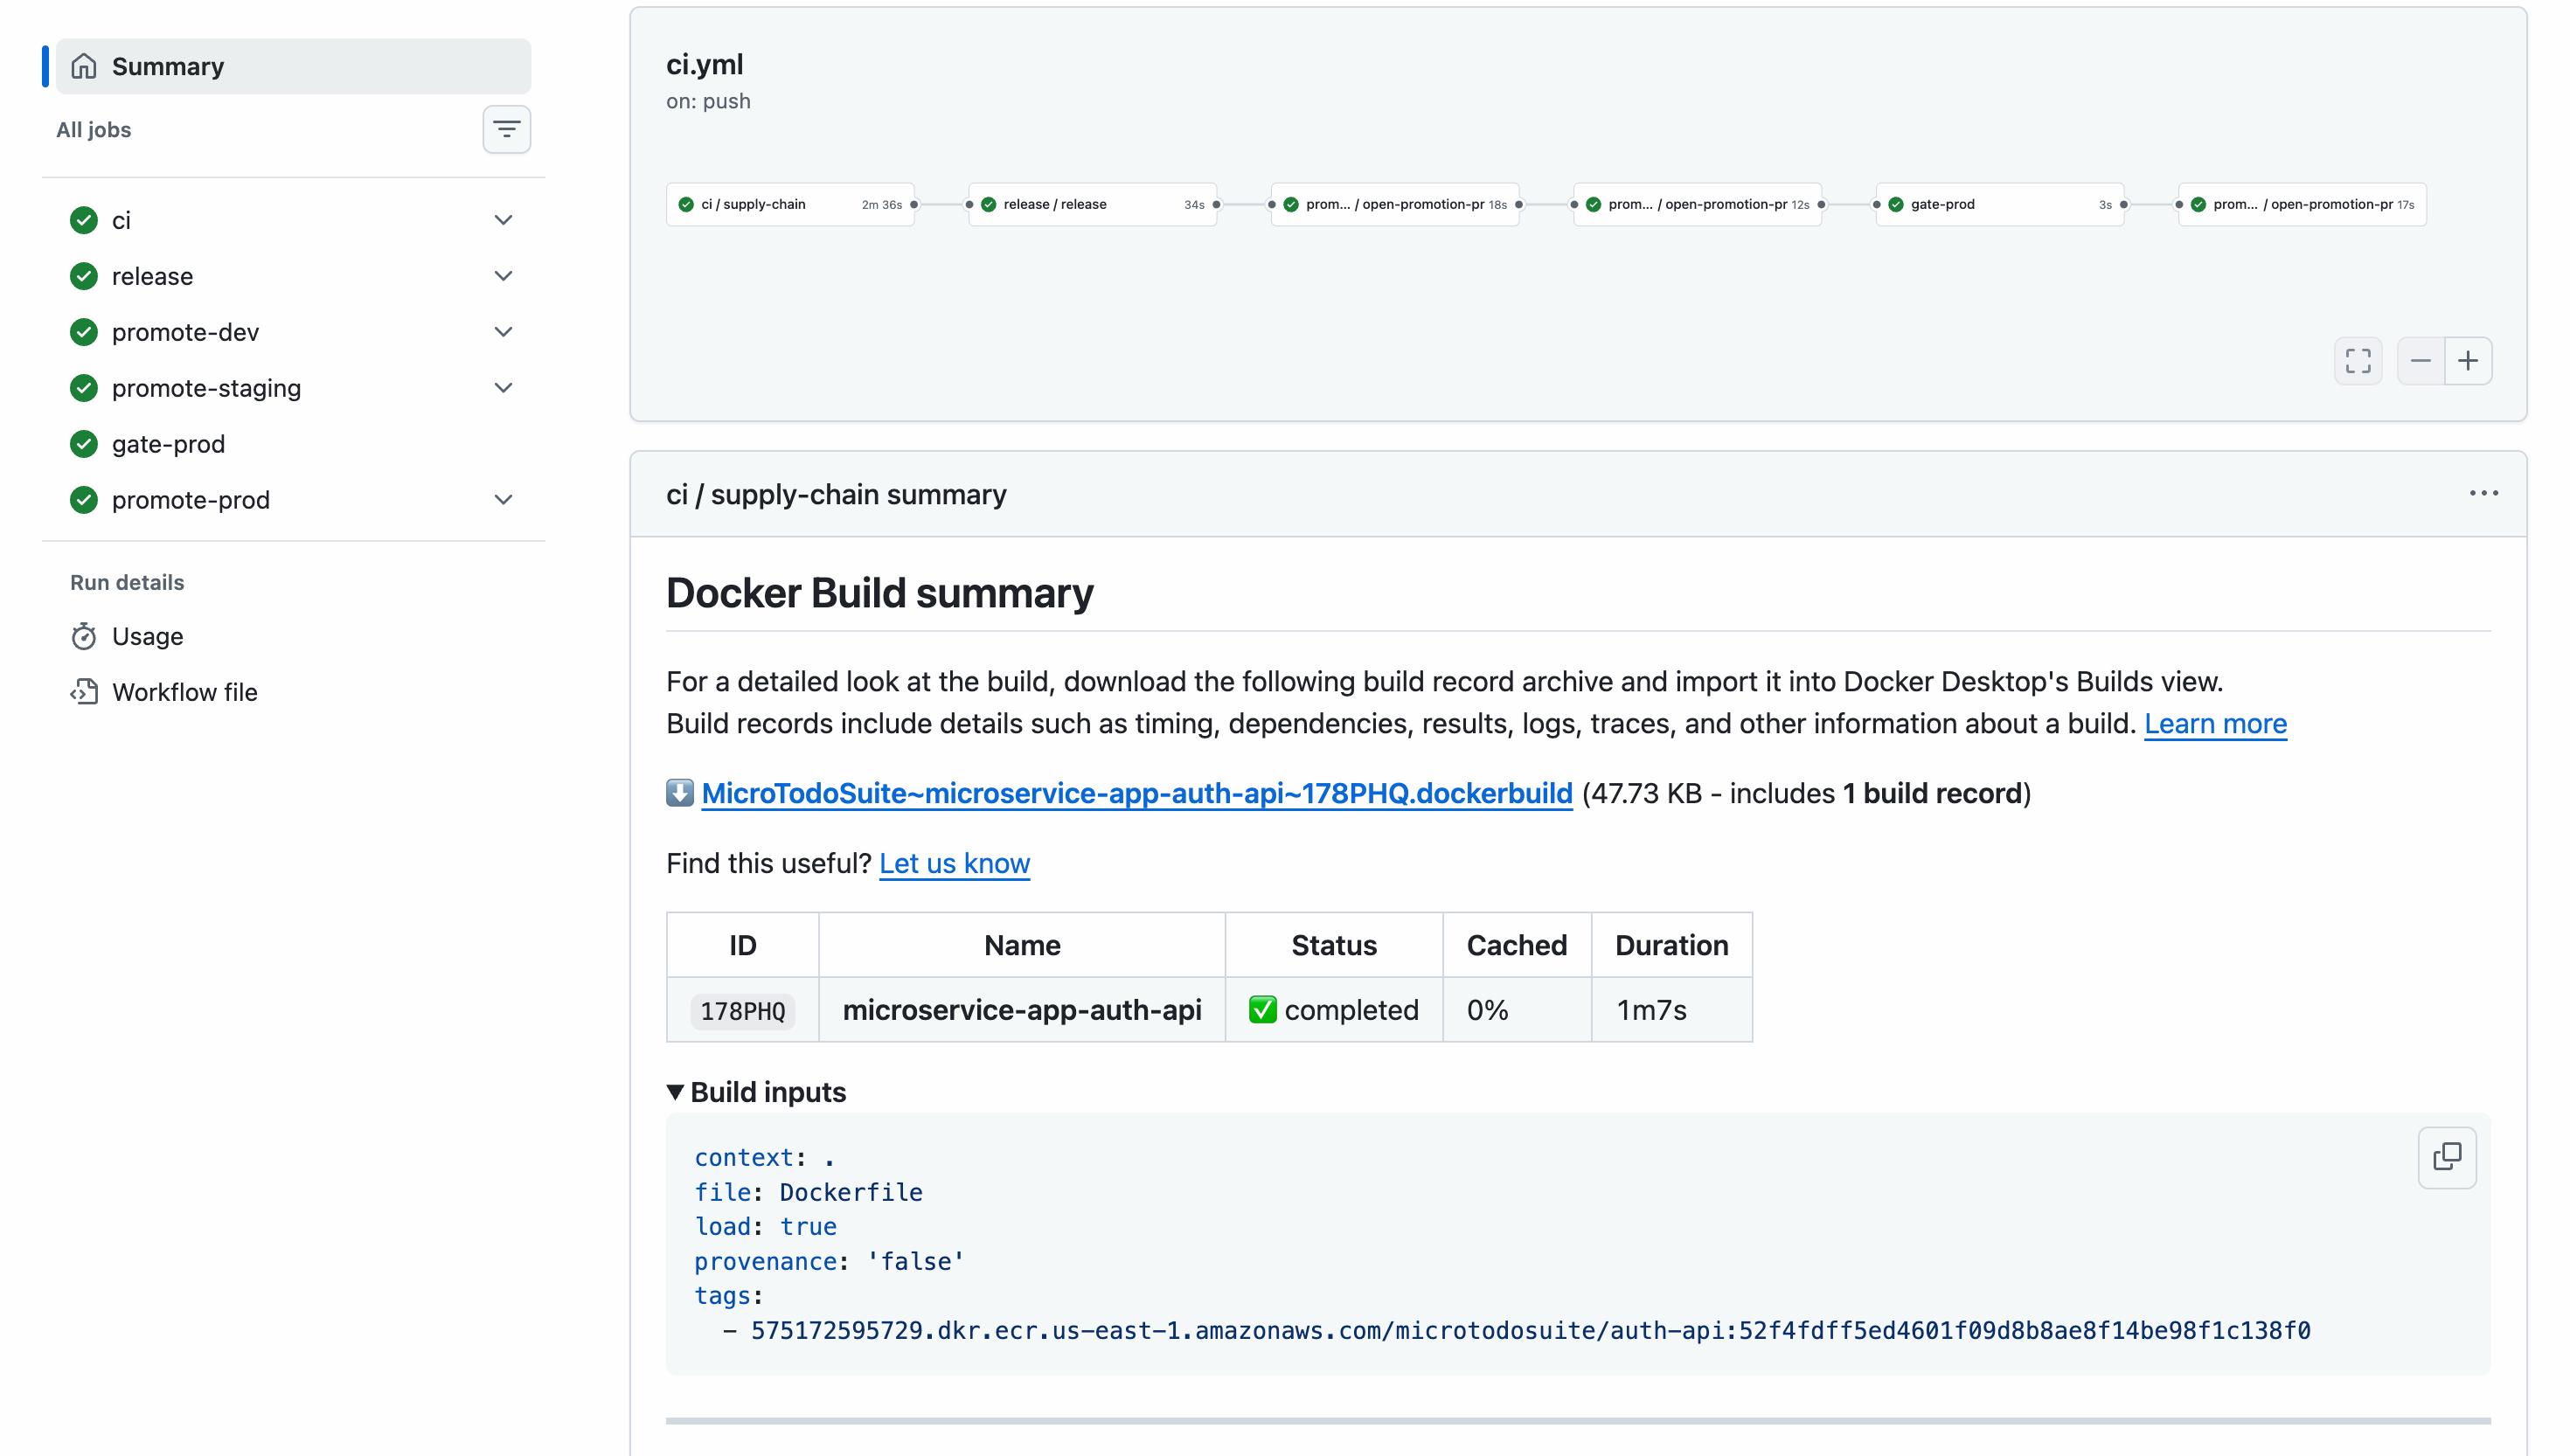
GitHub Actions run: ci, release, promote-dev, promote-staging, gate-prod and promote-prod all green for auth-api, with the Docker build pushed to ECR

The full ci → release → promote-dev → promote-staging → gate-prod → promote-prod chain, green end to end, with the signed image landing in ECR.

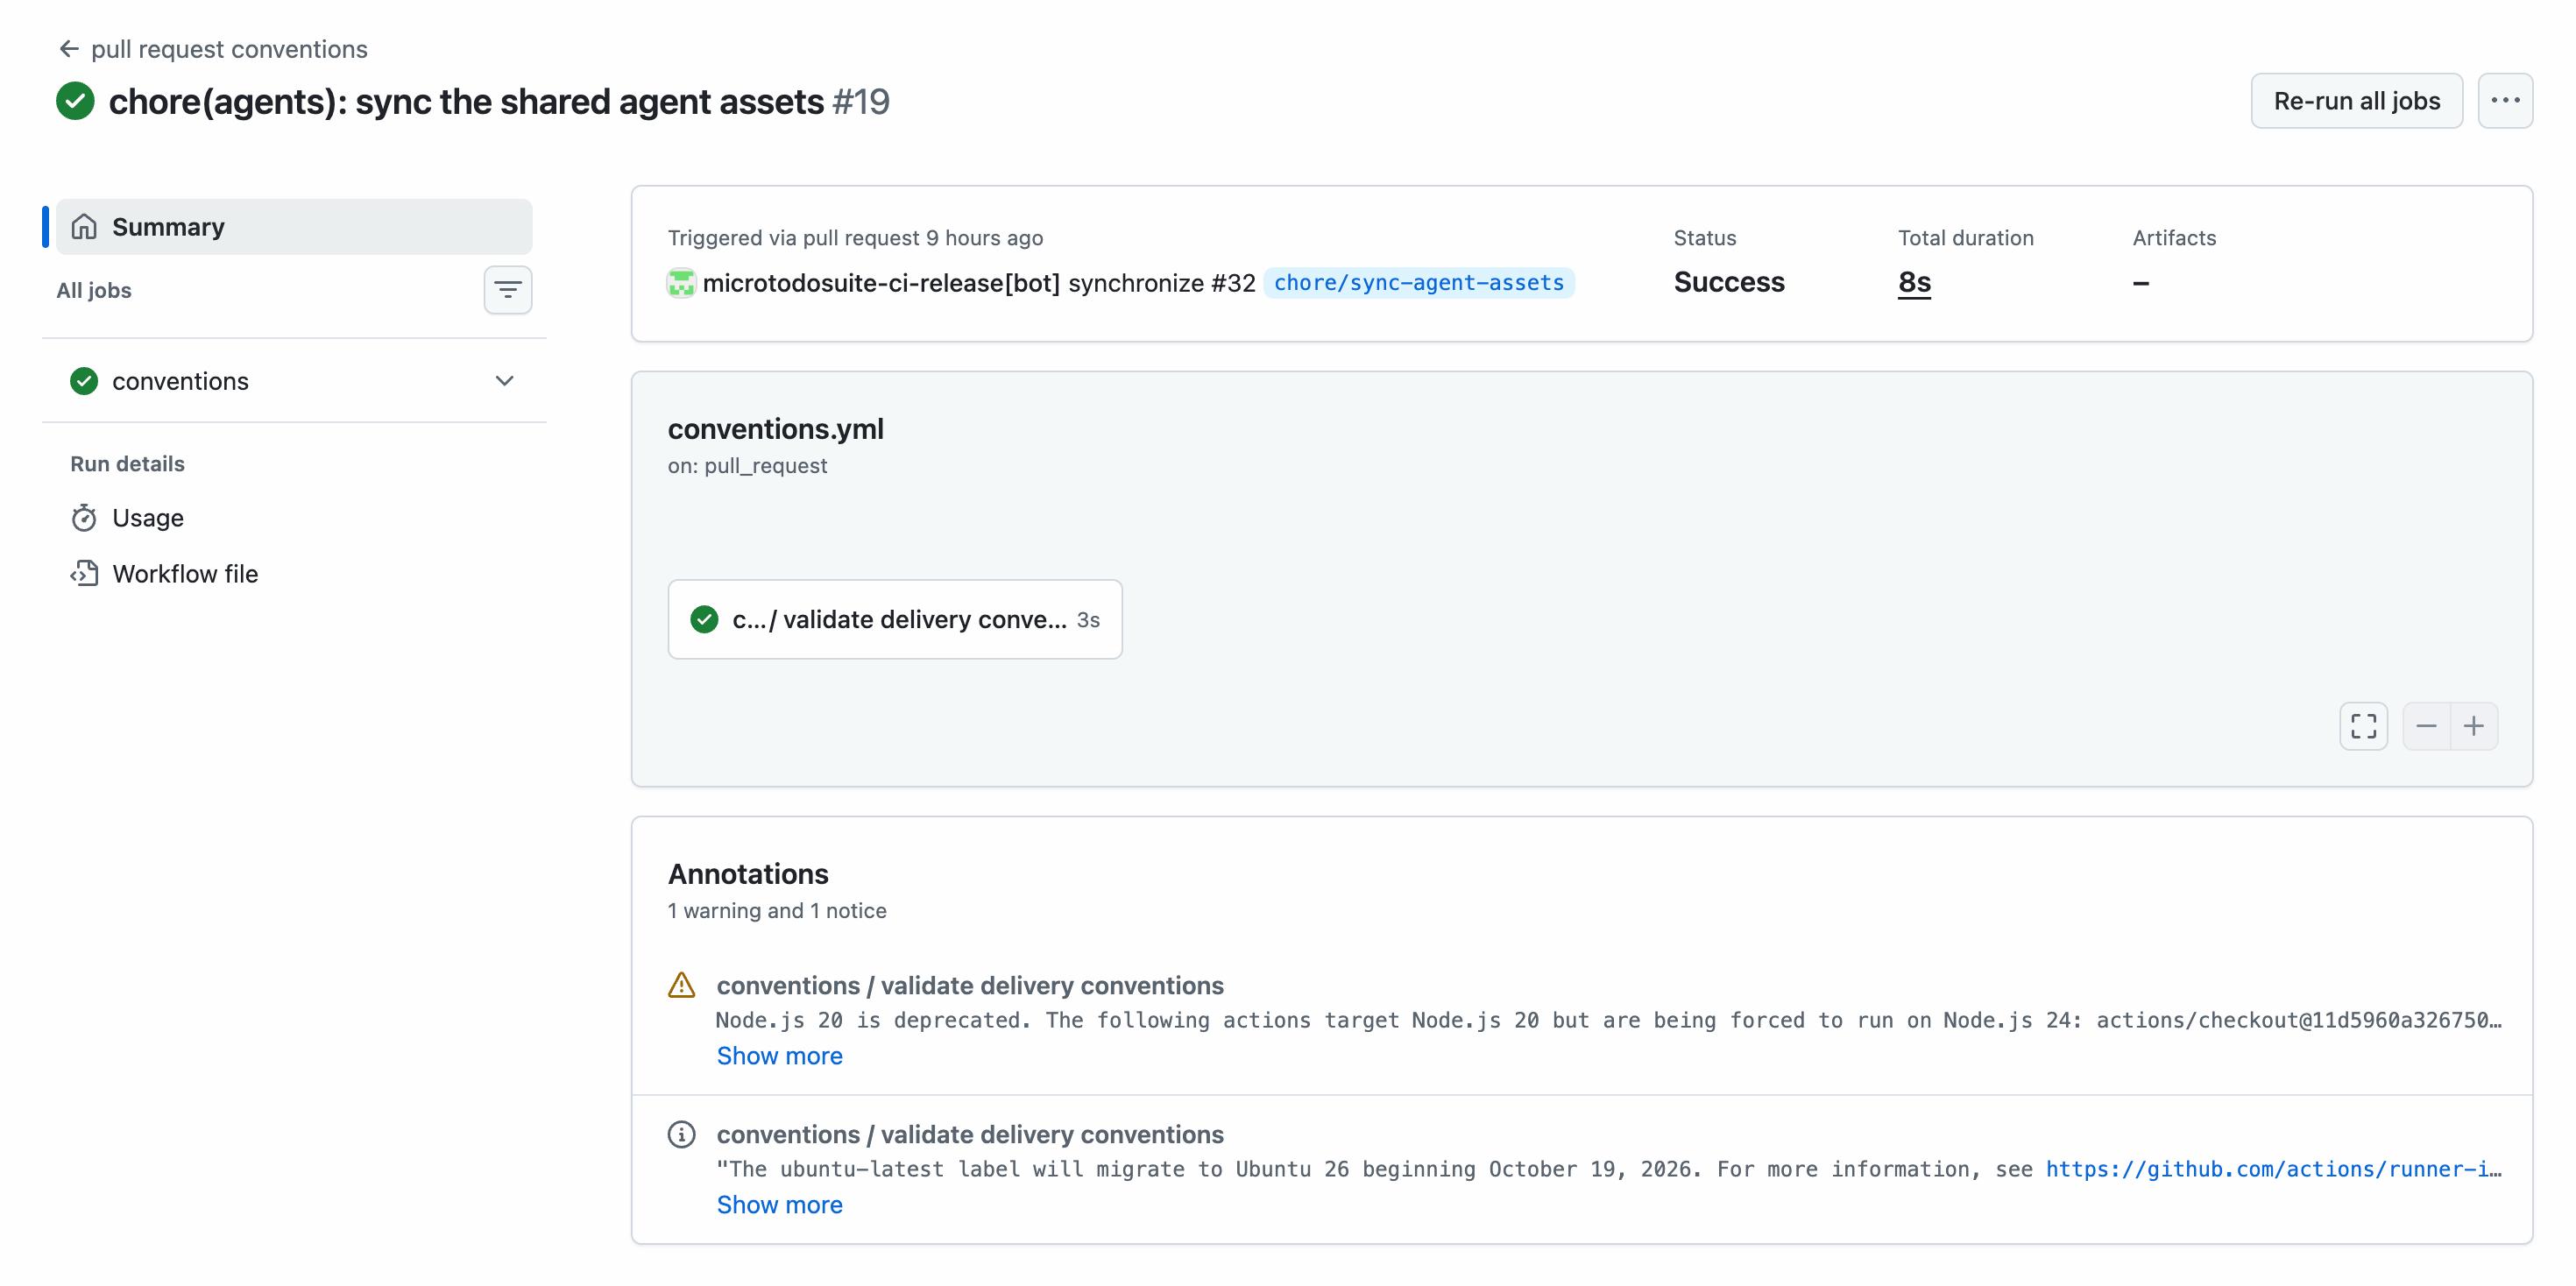
GitHub Actions run: the delivery-conventions check passing on a shared-agent-assets pull request

The reusable-workflow conventions gate, enforced on every pull request across the organization.

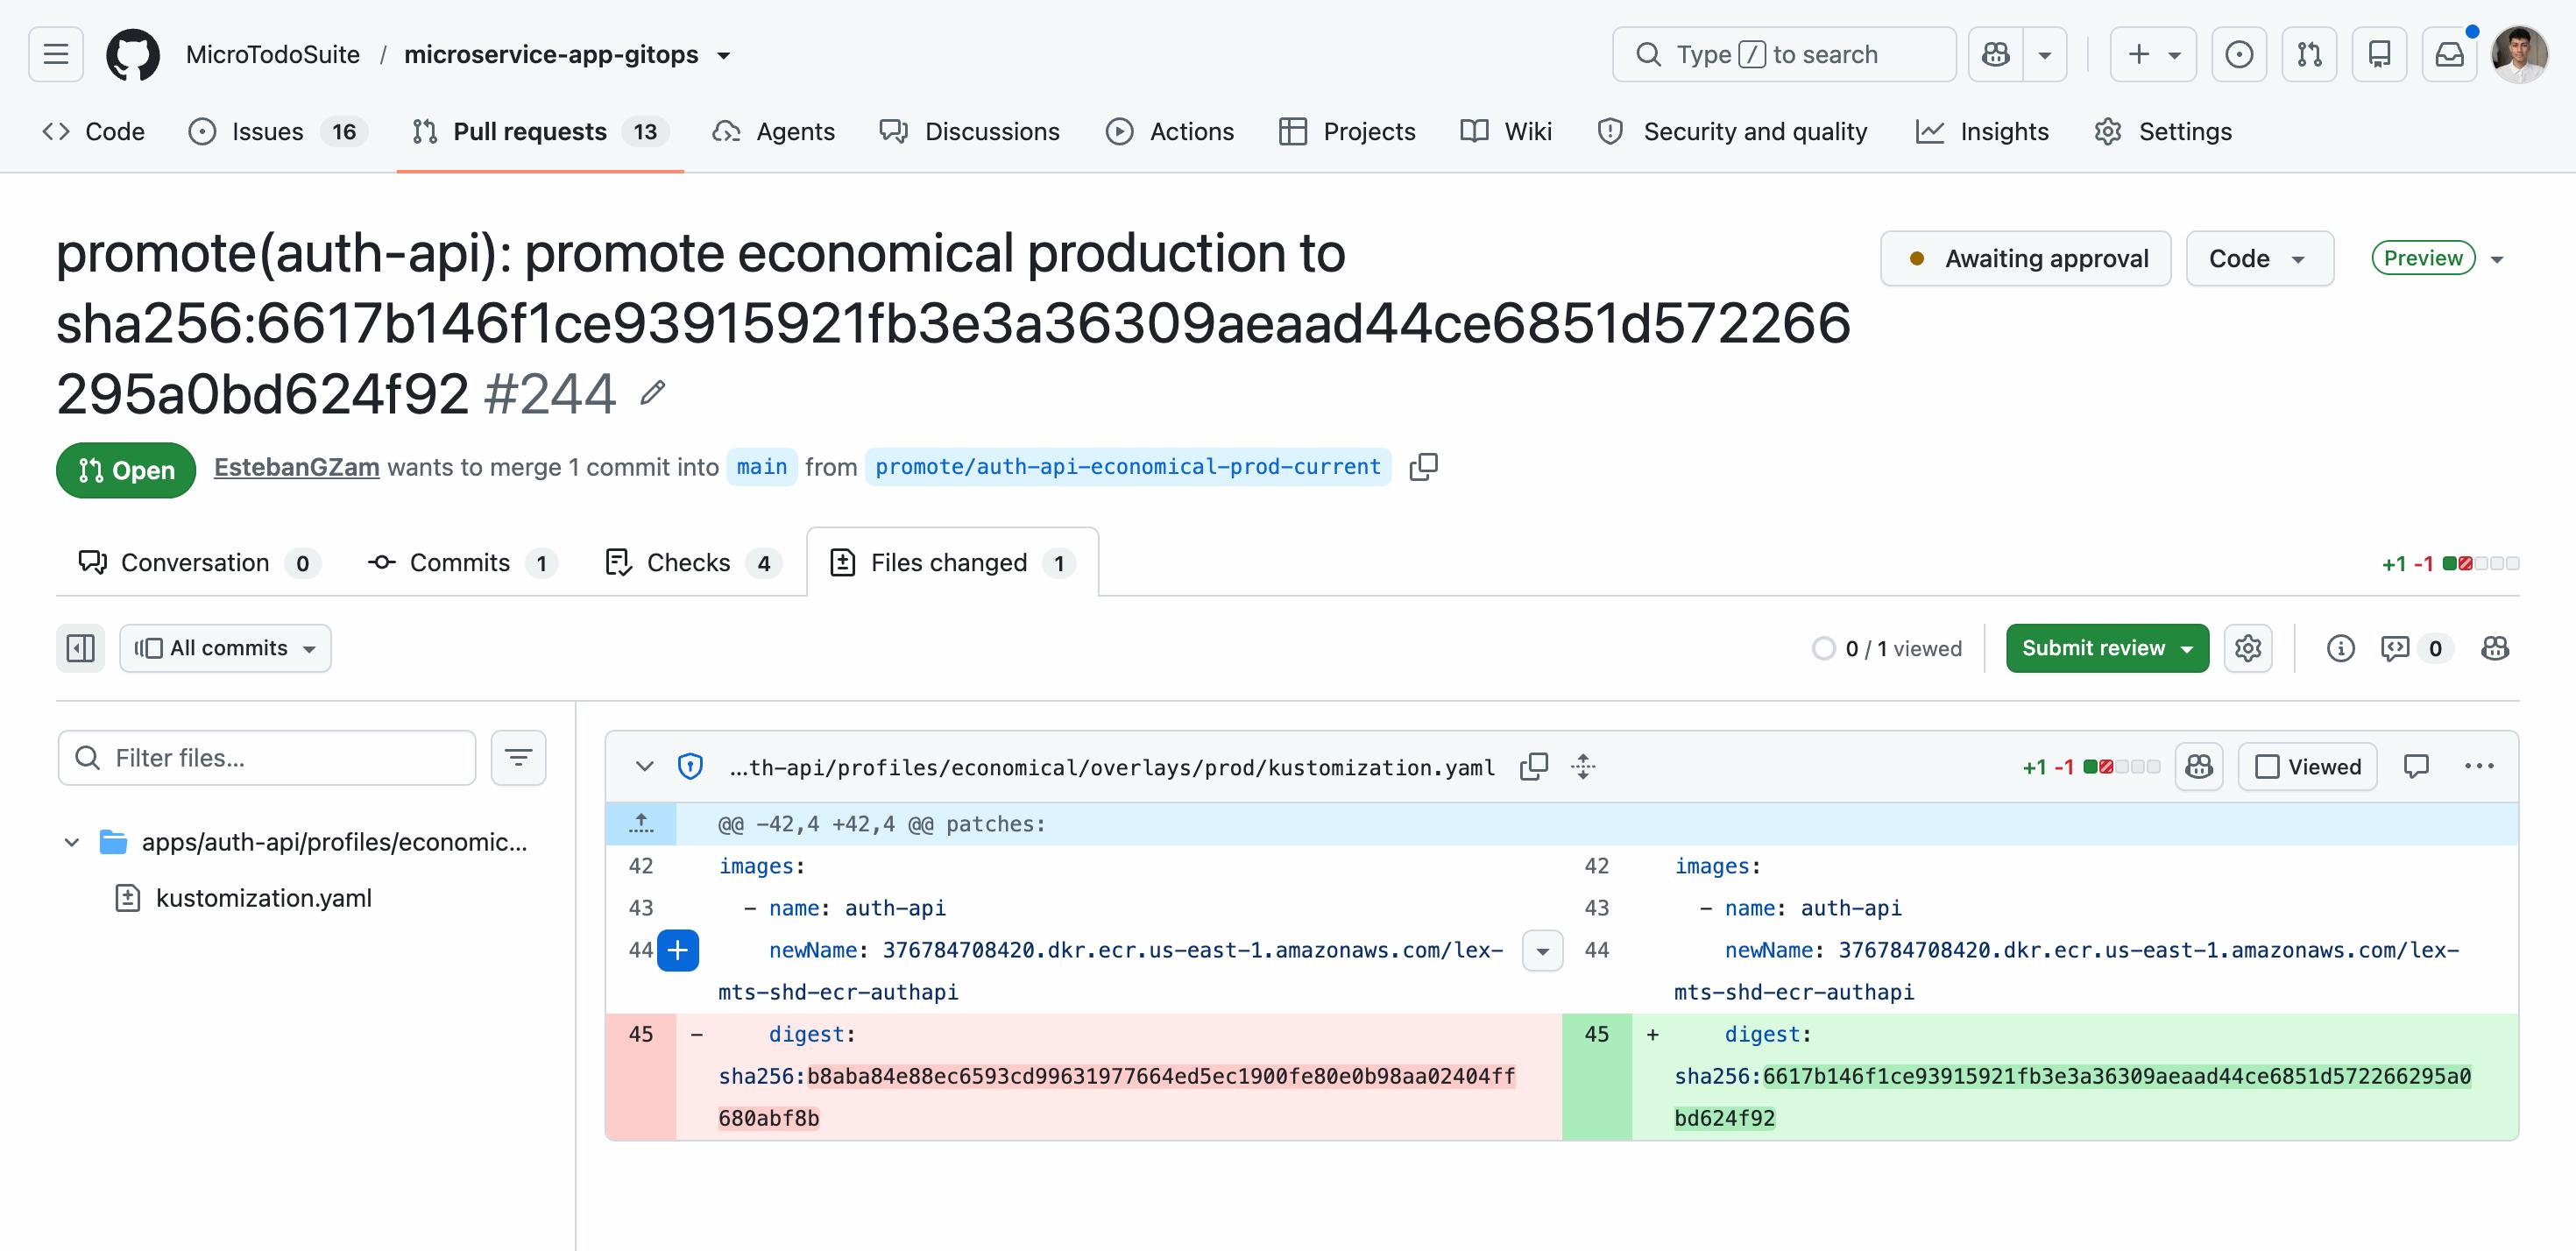
GitHub pull request: a digest-only promotion of auth-api to the economical prod overlay, awaiting human approval

A promotion pull request changing exactly one digest in the prod overlay — nothing else in the diff.

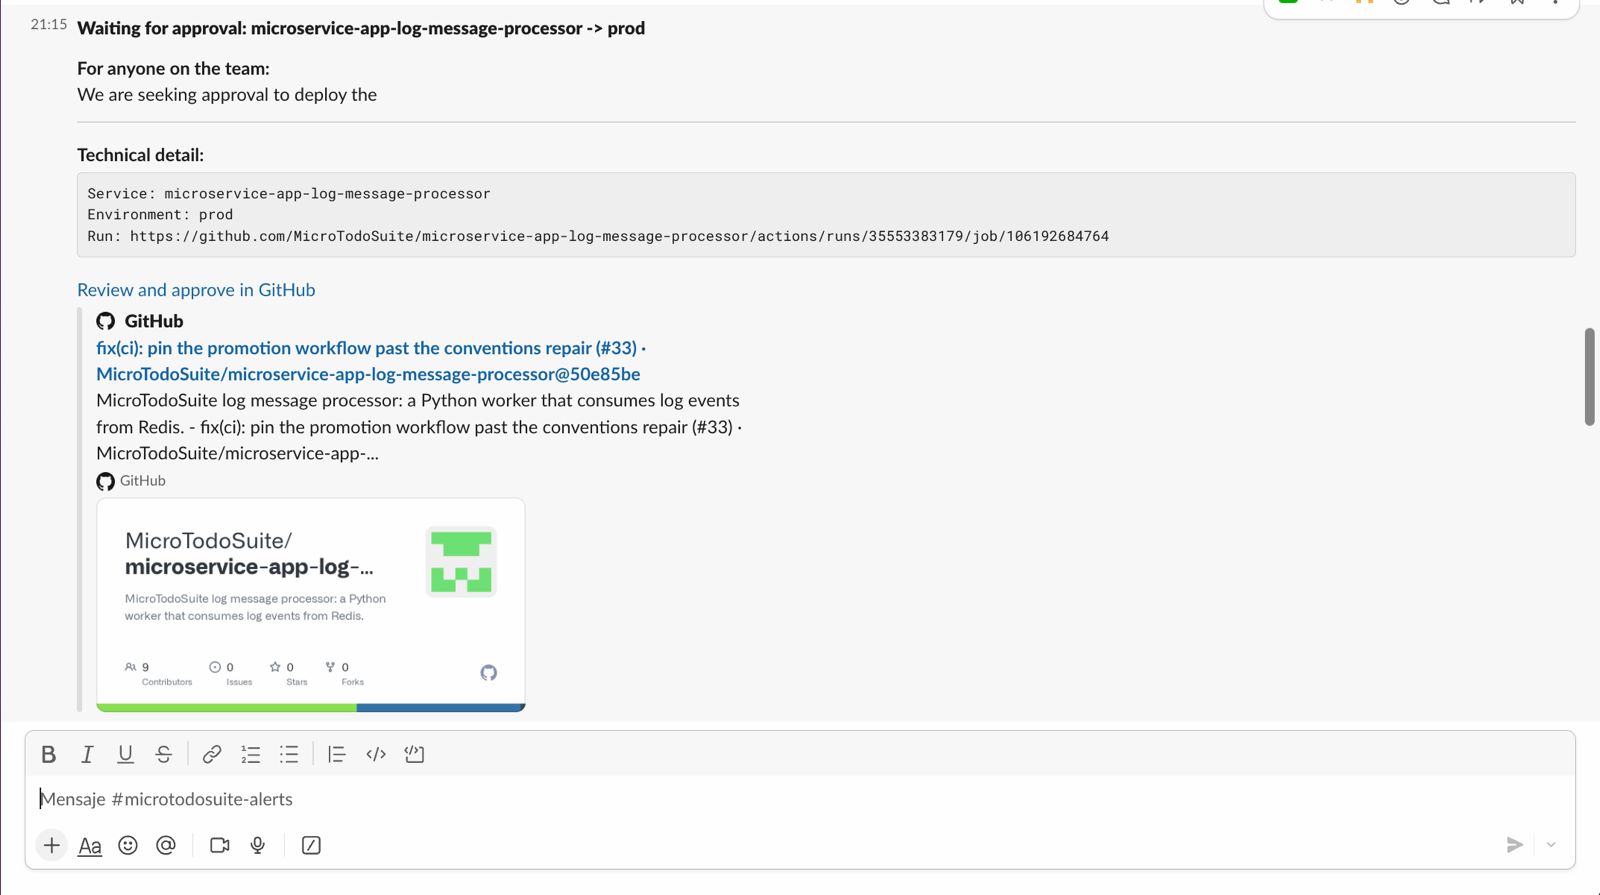
Slack message from the approval gateway app requesting production deploy approval for log-message-processor, linking the GitHub Actions run

The Slack approval gateway gating a production deploy of log-message-processor, linked back to the run it authorizes.

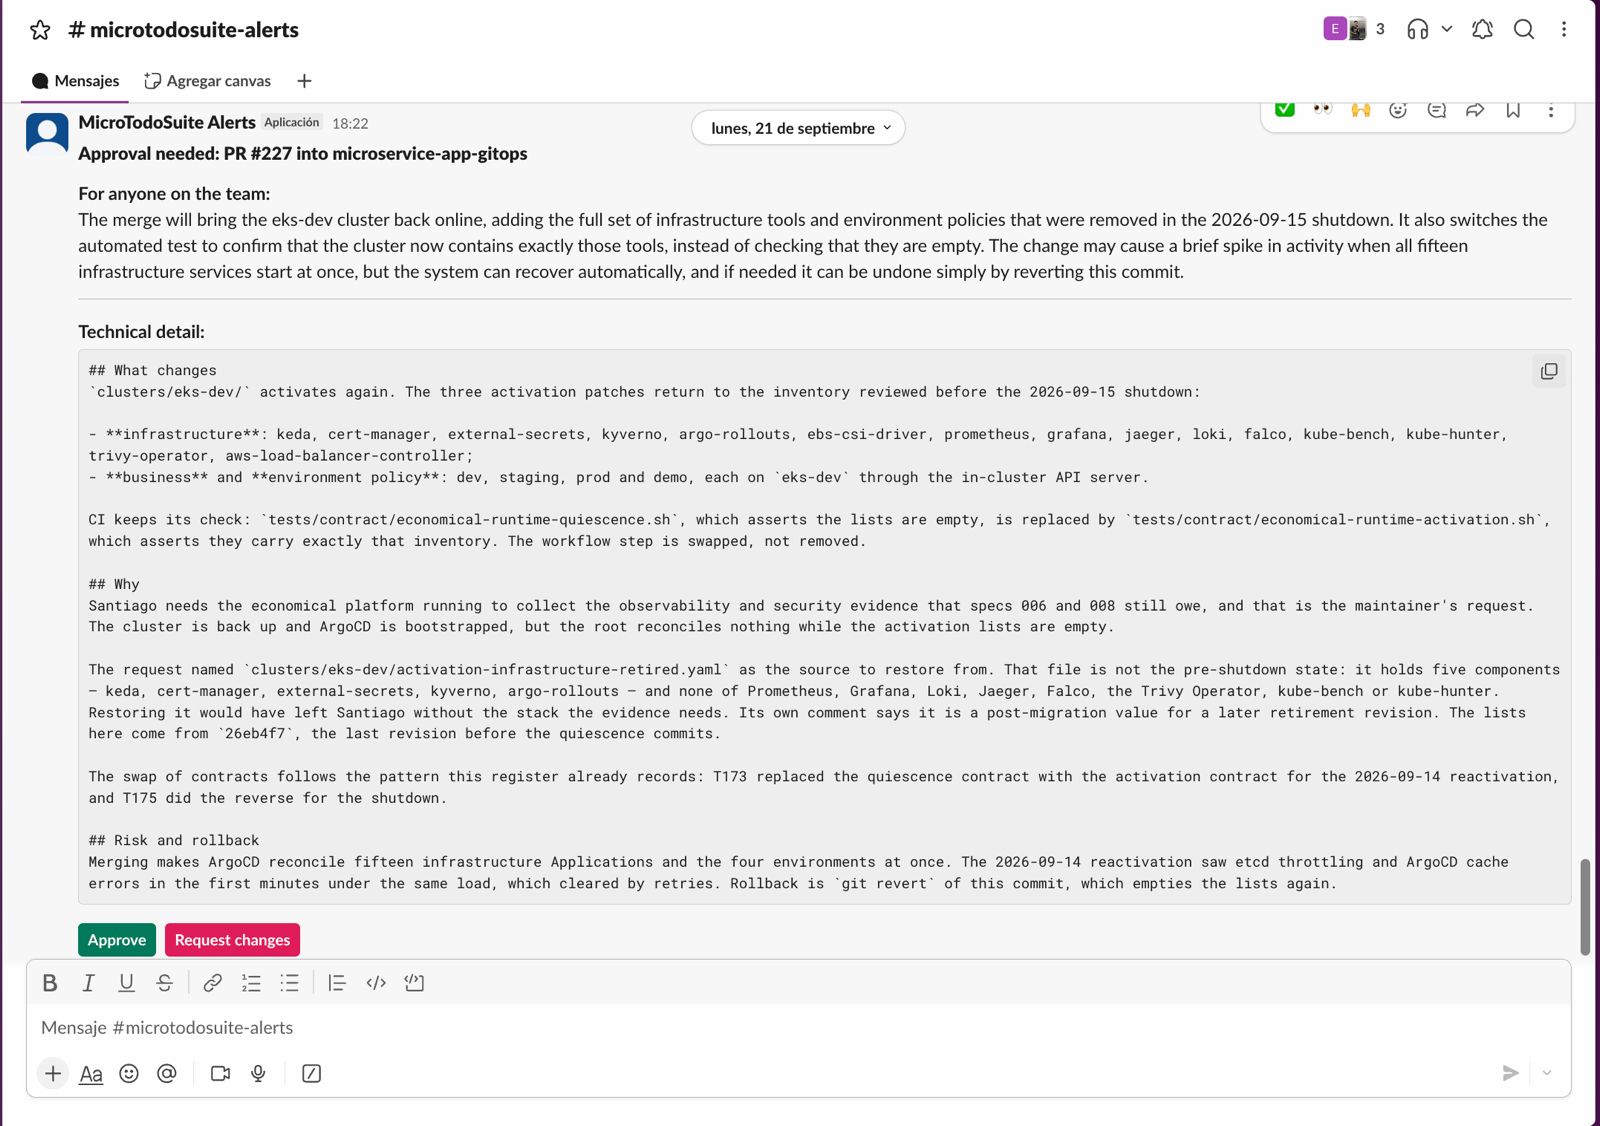
Slack message describing the eks-dev cluster reactivation: fifteen infrastructure components restored after the 2026-09-15 shutdown

The reviewed change that brought eks-dev and its full infrastructure list back online after the cost-driven shutdown.


Supply chain and runtime enforcement

Security is enforced at two points: what is allowed to be built and signed, and what is allowed to run — the second does not trust the first without re-checking it.

Sequence diagram: a commit becoming a signed image through OIDC, Trivy, Syft SBOM and Cosign keyless signing

Fig. 10 — a commit becomes a signed image: the reusable CI workflow builds once, and nothing downstream ever rebuilds it. Click to open full size.
Sequence diagram: a secret reaching a pod via IRSA and External Secrets Operator without ever touching Git

Fig. 11 — a secret reaches a pod without touching Git: the cluster reads AWS Secrets Manager with an identity bound to the pod's own ServiceAccount. Click to open full size.

Supply chain

  • Trivy blocks the pipeline on high/critical CVEs before an image is signed.
  • Syft-generated SBOMs are published alongside the image, not produced on demand later.
  • Cosign keyless signing removes long-lived signing keys entirely — trust is anchored to Sigstore's Fulcio CA and Rekor's public transparency log.

Runtime and cluster

  • Kyverno re-verifies signatures at admission — a signed-but-tampered or resigned image is caught independently of the pipeline that produced it.
  • No secret value is committed to Git; the External Secrets Operator fills contracts like auth-api-secrets/JWT_SECRET in-cluster.
  • GitOps discipline itself is a security control: the only path to a running change is a reviewed commit, which makes every production mutation attributable and revertible.

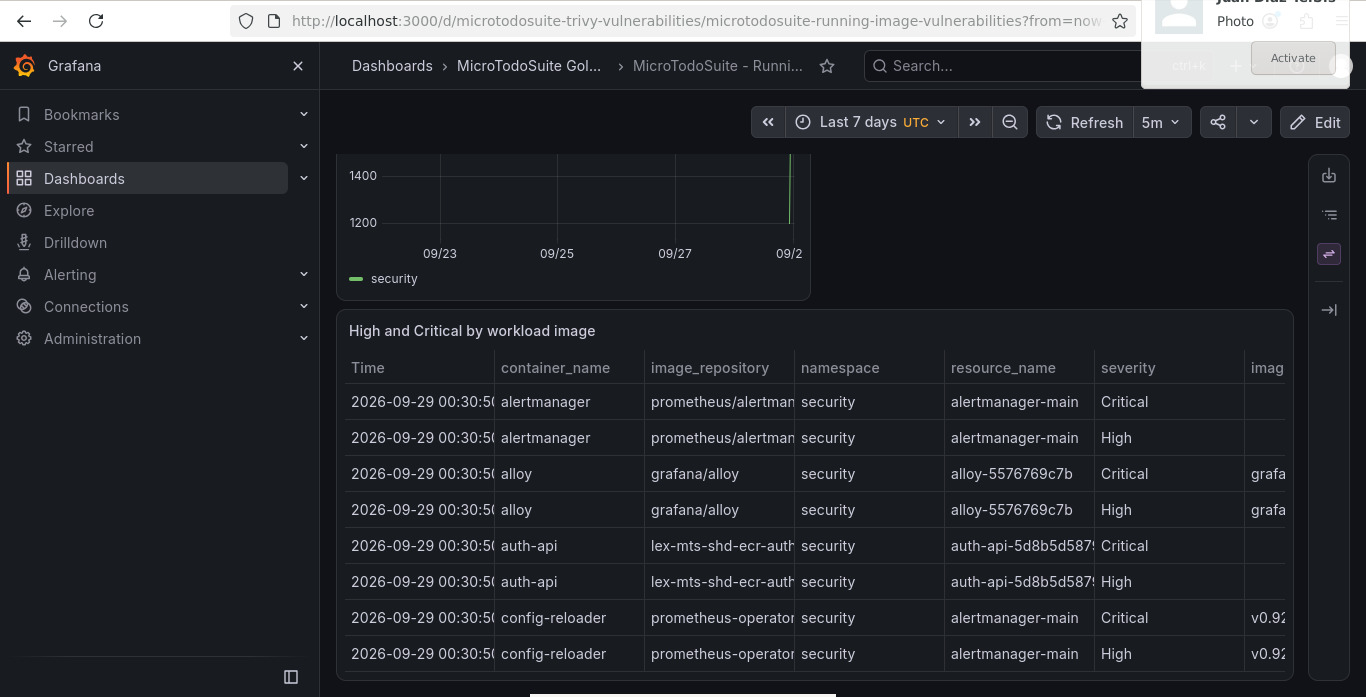
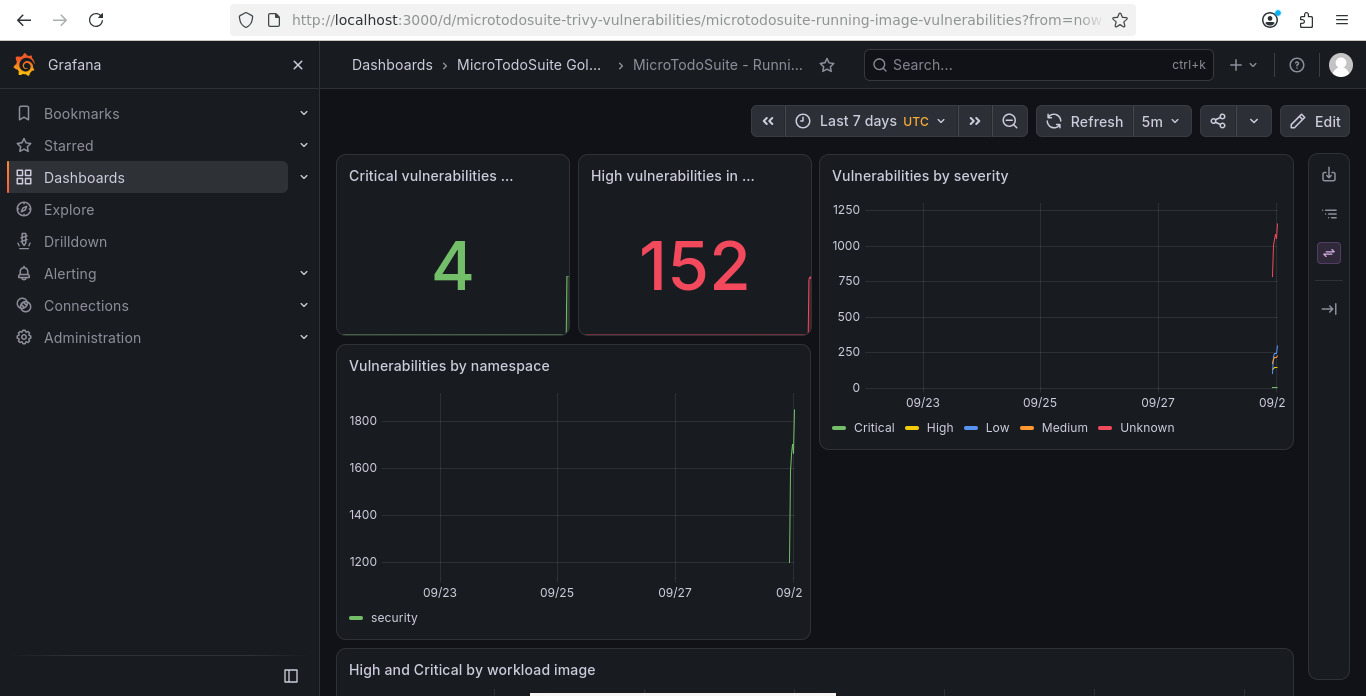
Evidence: vulnerability scanning, running against the live cluster

Trivy Operator's own Grafana dashboard, not a one-off CLI scan.

Grafana Trivy vulnerabilities dashboard: 4 critical, 152 high, vulnerabilities by severity and by namespace over 7 days

Trivy Operator's findings charted over the last 7 days: critical and high counts, by severity and by namespace.

Grafana table: high and critical vulnerabilities by workload image, container name and namespace

The same dashboard broken down to the workload image and container that owns each finding — actionable, not just a count.


Three pillars, owned by the platform, not by each service

A service earns metrics, traces, and structured logs by being deployed — it does not integrate a vendor SDK to get them.

metrics

Prometheus scrapes every service; Grafana dashboards are provisioned as code alongside the services they chart, including request-latency histograms with explicit bucket boundaries validated per service.

traces

Jaeger in the economical profile; the full profile's design carries the same trace propagation through an Istio mesh, so a request can be followed end to end without any service authoring its own tracing glue.

logs

Loki aggregates structured logs in the economical profile. The full profile's design swaps in ECK-managed Elasticsearch for higher query volume and longer retention, without changing what a service has to emit.

Observability flow: metrics, traces, logs and alerts from every workload to Grafana and a Slack channel

Fig. 12 — metrics, traces and logs from every workload to Grafana, plus the Alertmanager path to Slack for error-rate, latency and vulnerability alarms — a separate channel from the approval gateway below. Click to open full size.

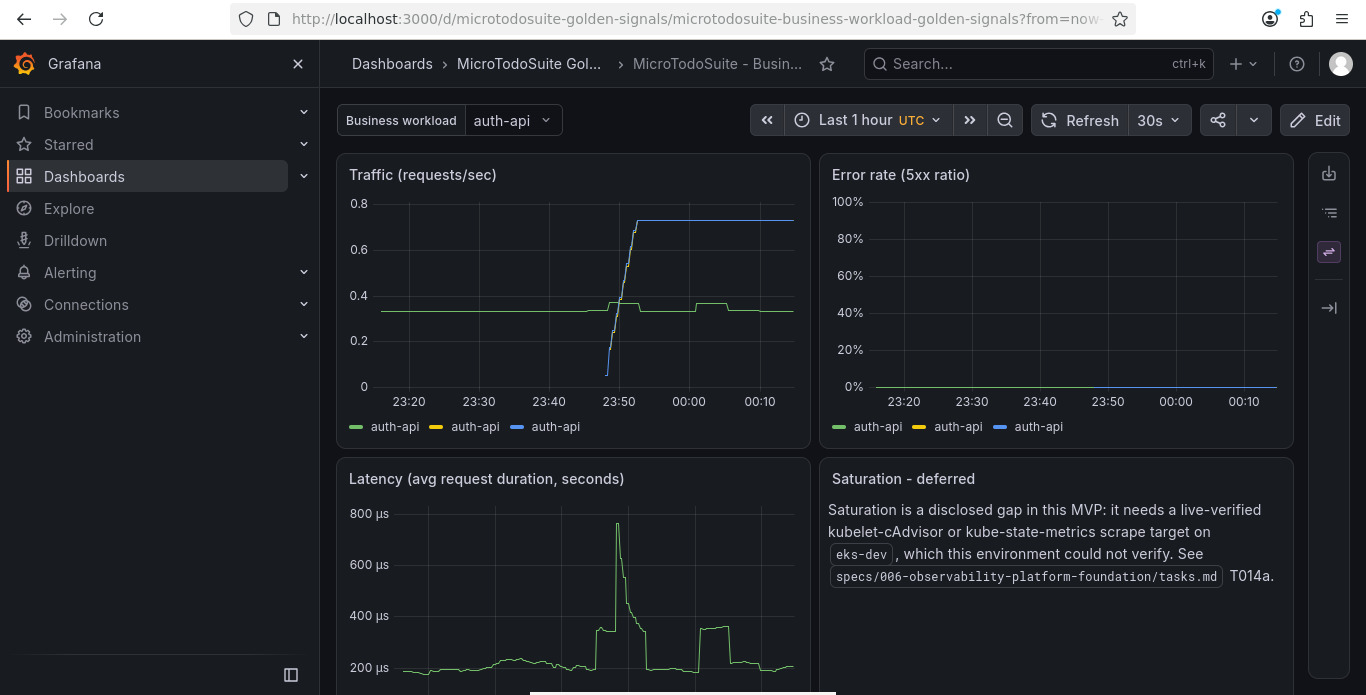
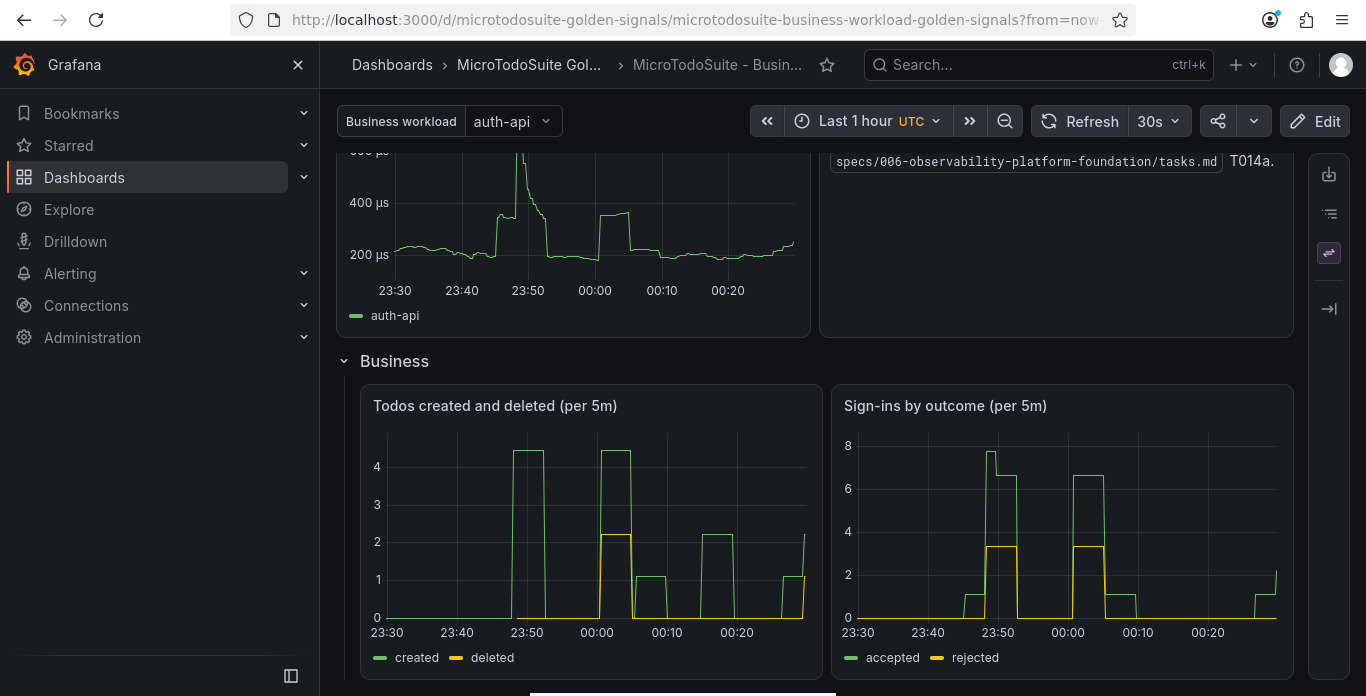
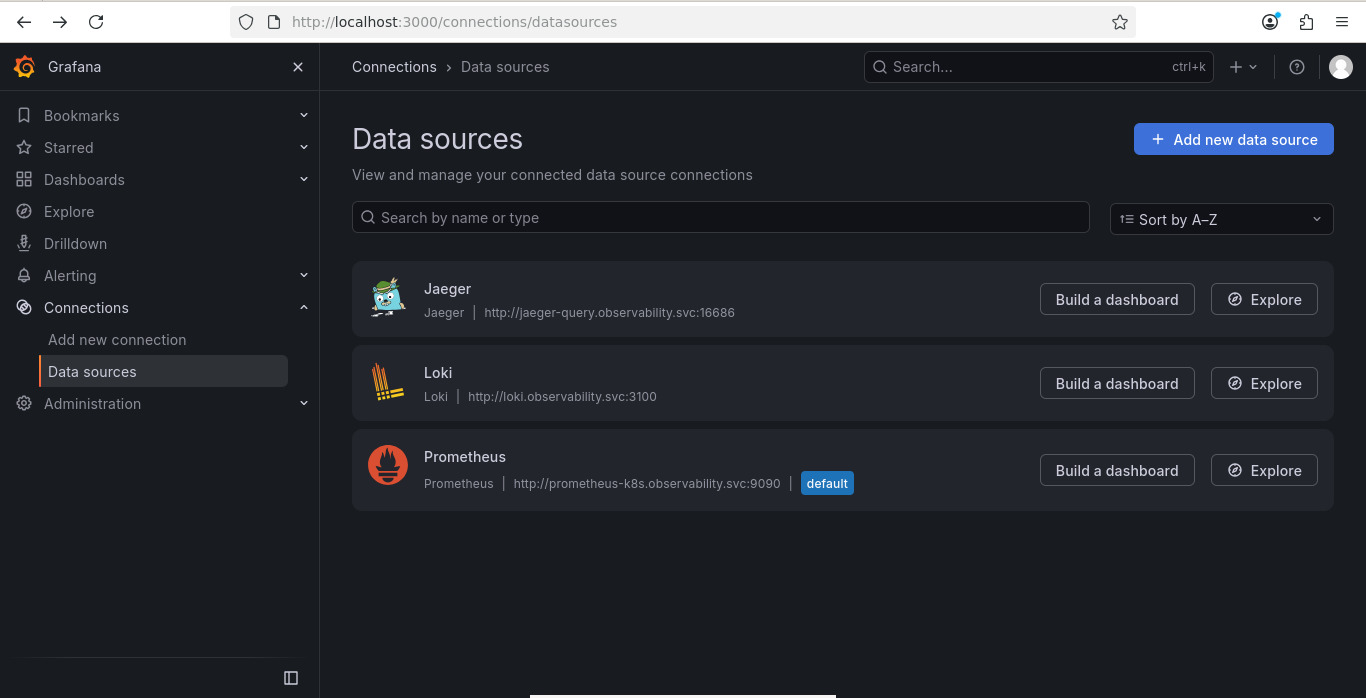
Evidence: the three pillars, queried live

Screenshots from Grafana, Prometheus and Jaeger against the reactivated eks-dev cluster — not mockups.

Grafana golden-signals dashboard for auth-api: traffic, error rate and latency charts over the last hour

The business-workload golden-signals dashboard for auth-api: traffic, error rate, and latency, provisioned as code.

Grafana business metrics: todos created and deleted, sign-ins by outcome, charted per 5 minutes

The same dashboard's business panels: todos created/deleted and sign-ins by outcome, not just infrastructure metrics.

Grafana data sources: Jaeger, Loki and Prometheus connected and reachable

All three pillars wired into the same Grafana as live data sources — Jaeger, Loki, and Prometheus.

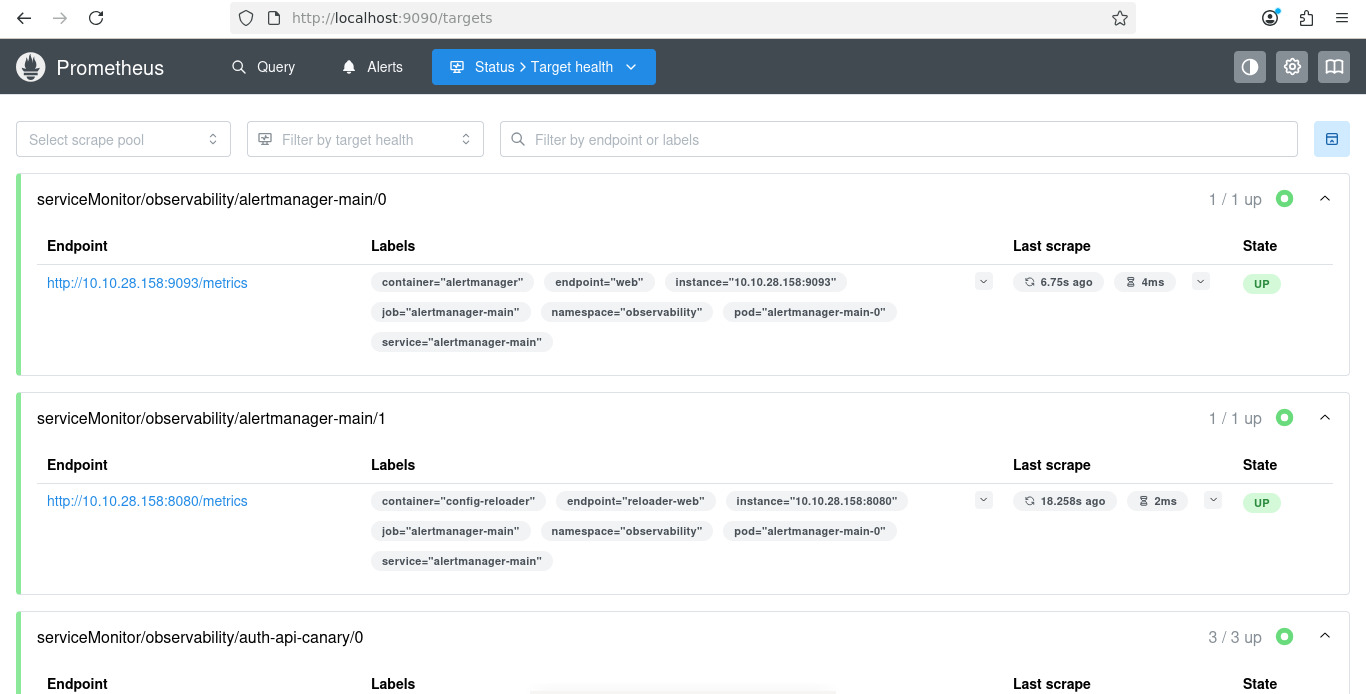
Prometheus targets page: alertmanager-main and auth-api-canary ServiceMonitors reporting UP

Prometheus's own target health: every ServiceMonitor it scrapes reporting UP.

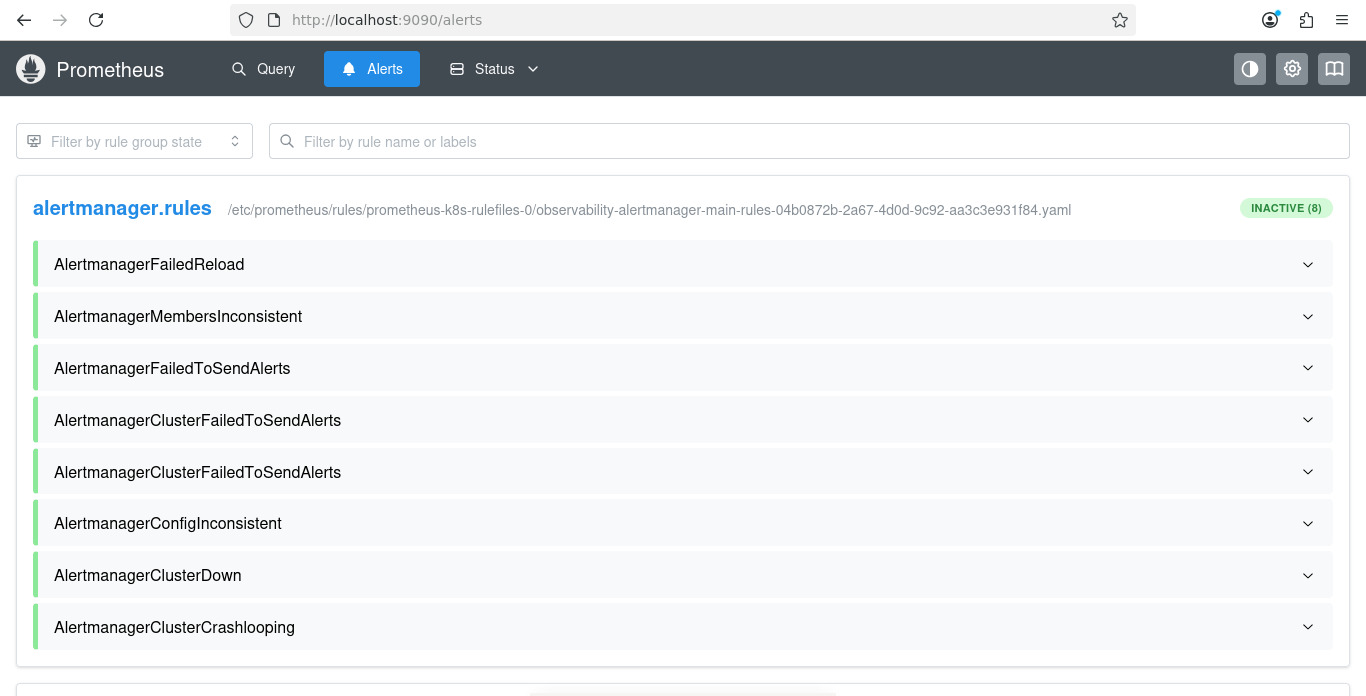
Prometheus alerts page: alertmanager.rules group, all eight alerts INACTIVE

The Alertmanager rule group loaded and evaluating, with all eight rules currently INACTIVE — a quiet platform, not a missing one.

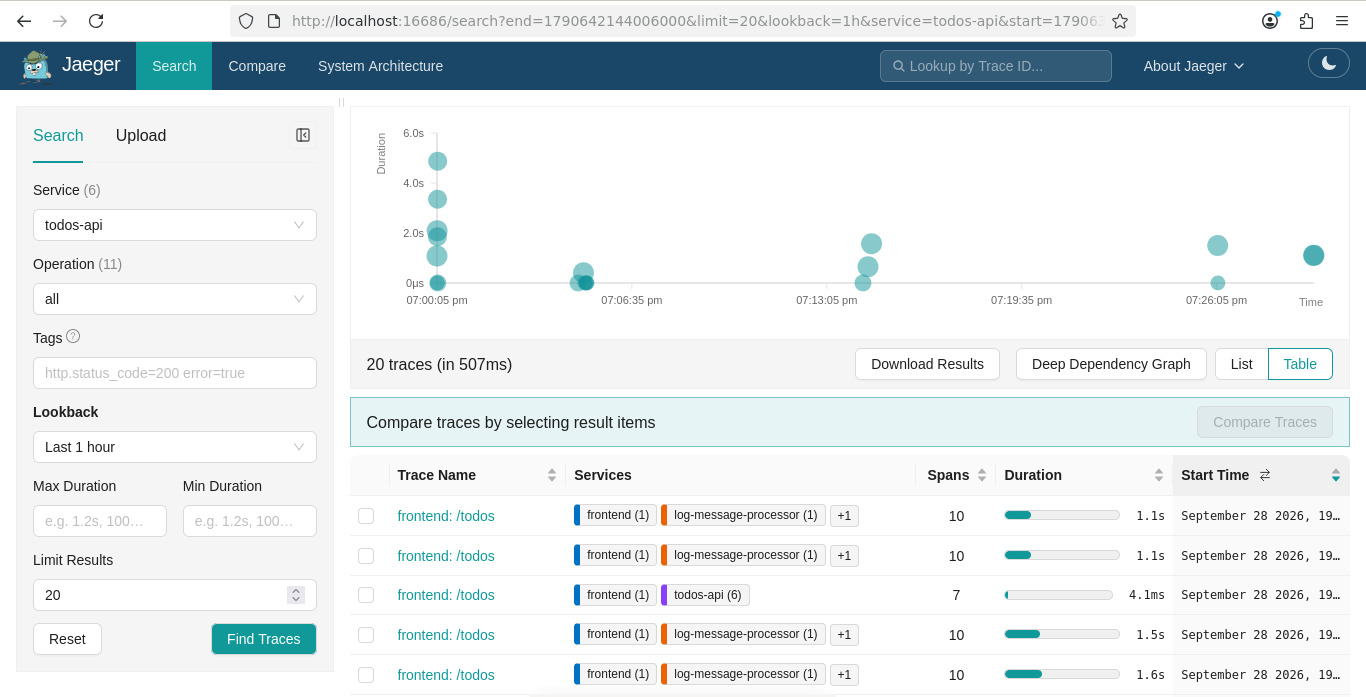
Jaeger trace search for todos-api: real traces spanning frontend, log-message-processor and todos-api

A real trace search in Jaeger: frontend → todos-api → log-message-processor spans, captured end to end.


A pyramid, applied at the boundary that actually catches the failure

Unit tests verify logic; contract, integration, and end-to-end tests verify that five independently deployed services still agree with each other.

Unit

Per-service, per-language, run on every pull request as the fastest gate in ci.yml.

Contract

Spectral lints published OpenAPI specs; Pact verifies consumer-driven contracts between the frontend and each API it calls; Schemathesis fuzzes API implementations against their own schema.

Integration

Testcontainers spins up real dependencies (Redis, databases) rather than mocking them — a lesson carried from a prior incident where a mocked dependency masked a real migration failure.

End-to-end

Playwright drives the composed stack through stack-tests.yml, exercising the actual login → create-todo → view flow across all five services.

Performance

Locust load-tests the composed stack to establish baseline latency and throughput before a capacity-affecting change ships.

DAST

OWASP ZAP scans the running stack for exploitable behavior that static analysis and unit tests structurally cannot see.


How changes are proposed, reviewed, and kept honest

Spec-Driven Development

Every feature is specified before it is implemented, and the specification's task list is what a pull request is measured against — not a green check or a rendered manifest. A task is marked complete only after its named artifact is located and inspected.

Trunk-based development

Short-lived branches, one concern per branch, Conventional Commit titles with a scope. The failing-test commit that specifies a change is committed before the implementation that makes it pass, and the pair is never squashed — it is the recorded evidence the cycle was followed.

Review gates that cannot be bypassed by the author

CODEOWNERS ties path ownership to required reviewers. No agent — human-directed or automated — merges with an admin override, force-pushes to main, or approves its own pull request. An automation identity may open and describe a change; only a named human unlocks the gate.

Reconciliation over silent edits

When a specification and reality disagree — a pinned version nobody actually shipped, a task register that doesn't match the code — the fix is a recorded reconciliation decision, not a quiet edit that erases the discrepancy.


Bringing the human-approval gate to where the team already works

Every change to any cluster passes through a required human review on the GitOps pull request. That review used to require someone to be inside GitHub to act on it; it does not anymore.

What it does

  • A GitHub App posts a Slack message for every gitops pull request, with a plain-language, model-generated summary of what the change does and why — built strictly from the pull request's own validated sections, never invented.
  • An authorized reviewer approves or requests changes directly from Slack; the app mints a short-lived GitHub App installation token and acts through the standard review API — this counts toward the branch's required review count exactly as a normal review would.
  • Deployment-gate pauses (the separate environment: prod approval each service's own pipeline enforces) get a rich Slack notification with a direct link, since that gate's human-identity requirement cannot be satisfied by an app — GitHub's own approval UI is kept exactly as it is.

How it is built

  • Two AWS Lambda functions behind an API Gateway HTTP API — no always-on server, no new cluster ingress.
  • Groq's OpenAI-compatible API drafts the non-technical summary; the prompt supplies only the pull request's own verbatim sections as ground truth.
  • An Infracost cost estimate is attached to the same message, so a reviewer sees the change's cost impact next to its technical description.
  • Every credential — the GitHub App key, the Slack signing secret, the Groq key — is an ephemeral, write-only Terraform variable in AWS Secrets Manager, never a static CI secret.

What the platform costs, and how a change's cost gets reviewed before it merges

Every figure below comes from Infracost run against the exact Terraform that was actually applied — not a spreadsheet estimate — and every pull request that changes infrastructure carries its own cost delta into the same Slack message a reviewer approves from.

DimensionEconomical profileFull profileBoth, running together
Monthly costPriced per change, not as one total (see FinOps below)USD 617.20 — Infracost-verified against the applied planabout USD 930 — on-demand list price, not Infracost-verified
EKS control planes134
NAT gateways3 — one per AZ2 — shared egress hub5
Bootstrap nodes23 — one per cluster5
Transit Gateway attachments033

Component counts and the combined list price come from microservice-app-docs/full-platform/capacity-and-regions.md. The full profile's own total below is the one figure on this page Infracost verified against a real applied plan.

RootScopeReal monthly cost (Infracost)
Hub networking (shd)Shared egress and Transit Gateway hub, one per accountUSD 73.00
Spoke networking × 3fdev, fstg, fprd — one VPC eachUSD 36.50 each — USD 109.50 total
Workload × 3fdev, fstg, fprd — one EKS cluster and node group eachUSD 144.90 each — USD 434.70 total
Total, full-profile foundationsApplied 2026-09-14, re-upped 2026-09-21USD 617.20 / month

Projected weekly

USD 142.43

Projected monthly

USD 617.20

Projected annual

USD 7,406.40

This is the AWS foundation layer actually standing today for the full profile: three isolated networks, three EKS control planes and node groups, and the shared egress hub — verified by Infracost against the exact saved Terraform plan for each root, not a list-price guess. It does not yet include Istio, ECK-managed Elasticsearch, or any business workload, because none of those are deployed (see State). It also does not include the economical profile's own spend, which the evidence does not roll up into one figure — every change to it is priced individually by the mechanism below instead.

FinOps on every pull request, not just on the platform

A Terraform change is priced before it is reviewed, not after it is merged.

PR touches a root
infracost breakdown per changed root
comment posted on the GitHub PR
signed webhook to the approval gateway
dollar delta shown in Slack
reviewer approves or requests changes

A profile goes down and comes back — the same way every time

aws-profile-lifecycle.sh in microservice-app-ops is the only way the runtime is created or destroyed. Applies use a saved plan and nothing else, and the way down needs no GitOps pull request.

Sequence diagram: a profile going down and coming back through EBS snapshot receipts, checksummed evidence, and saved-plan-only Terraform applies

Fig. 13 — exactly how the economical runtime is quiesced and rebuilt: snapshot receipts, checksummed evidence, and applies that use a saved plan and nothing else. Click to open full size.
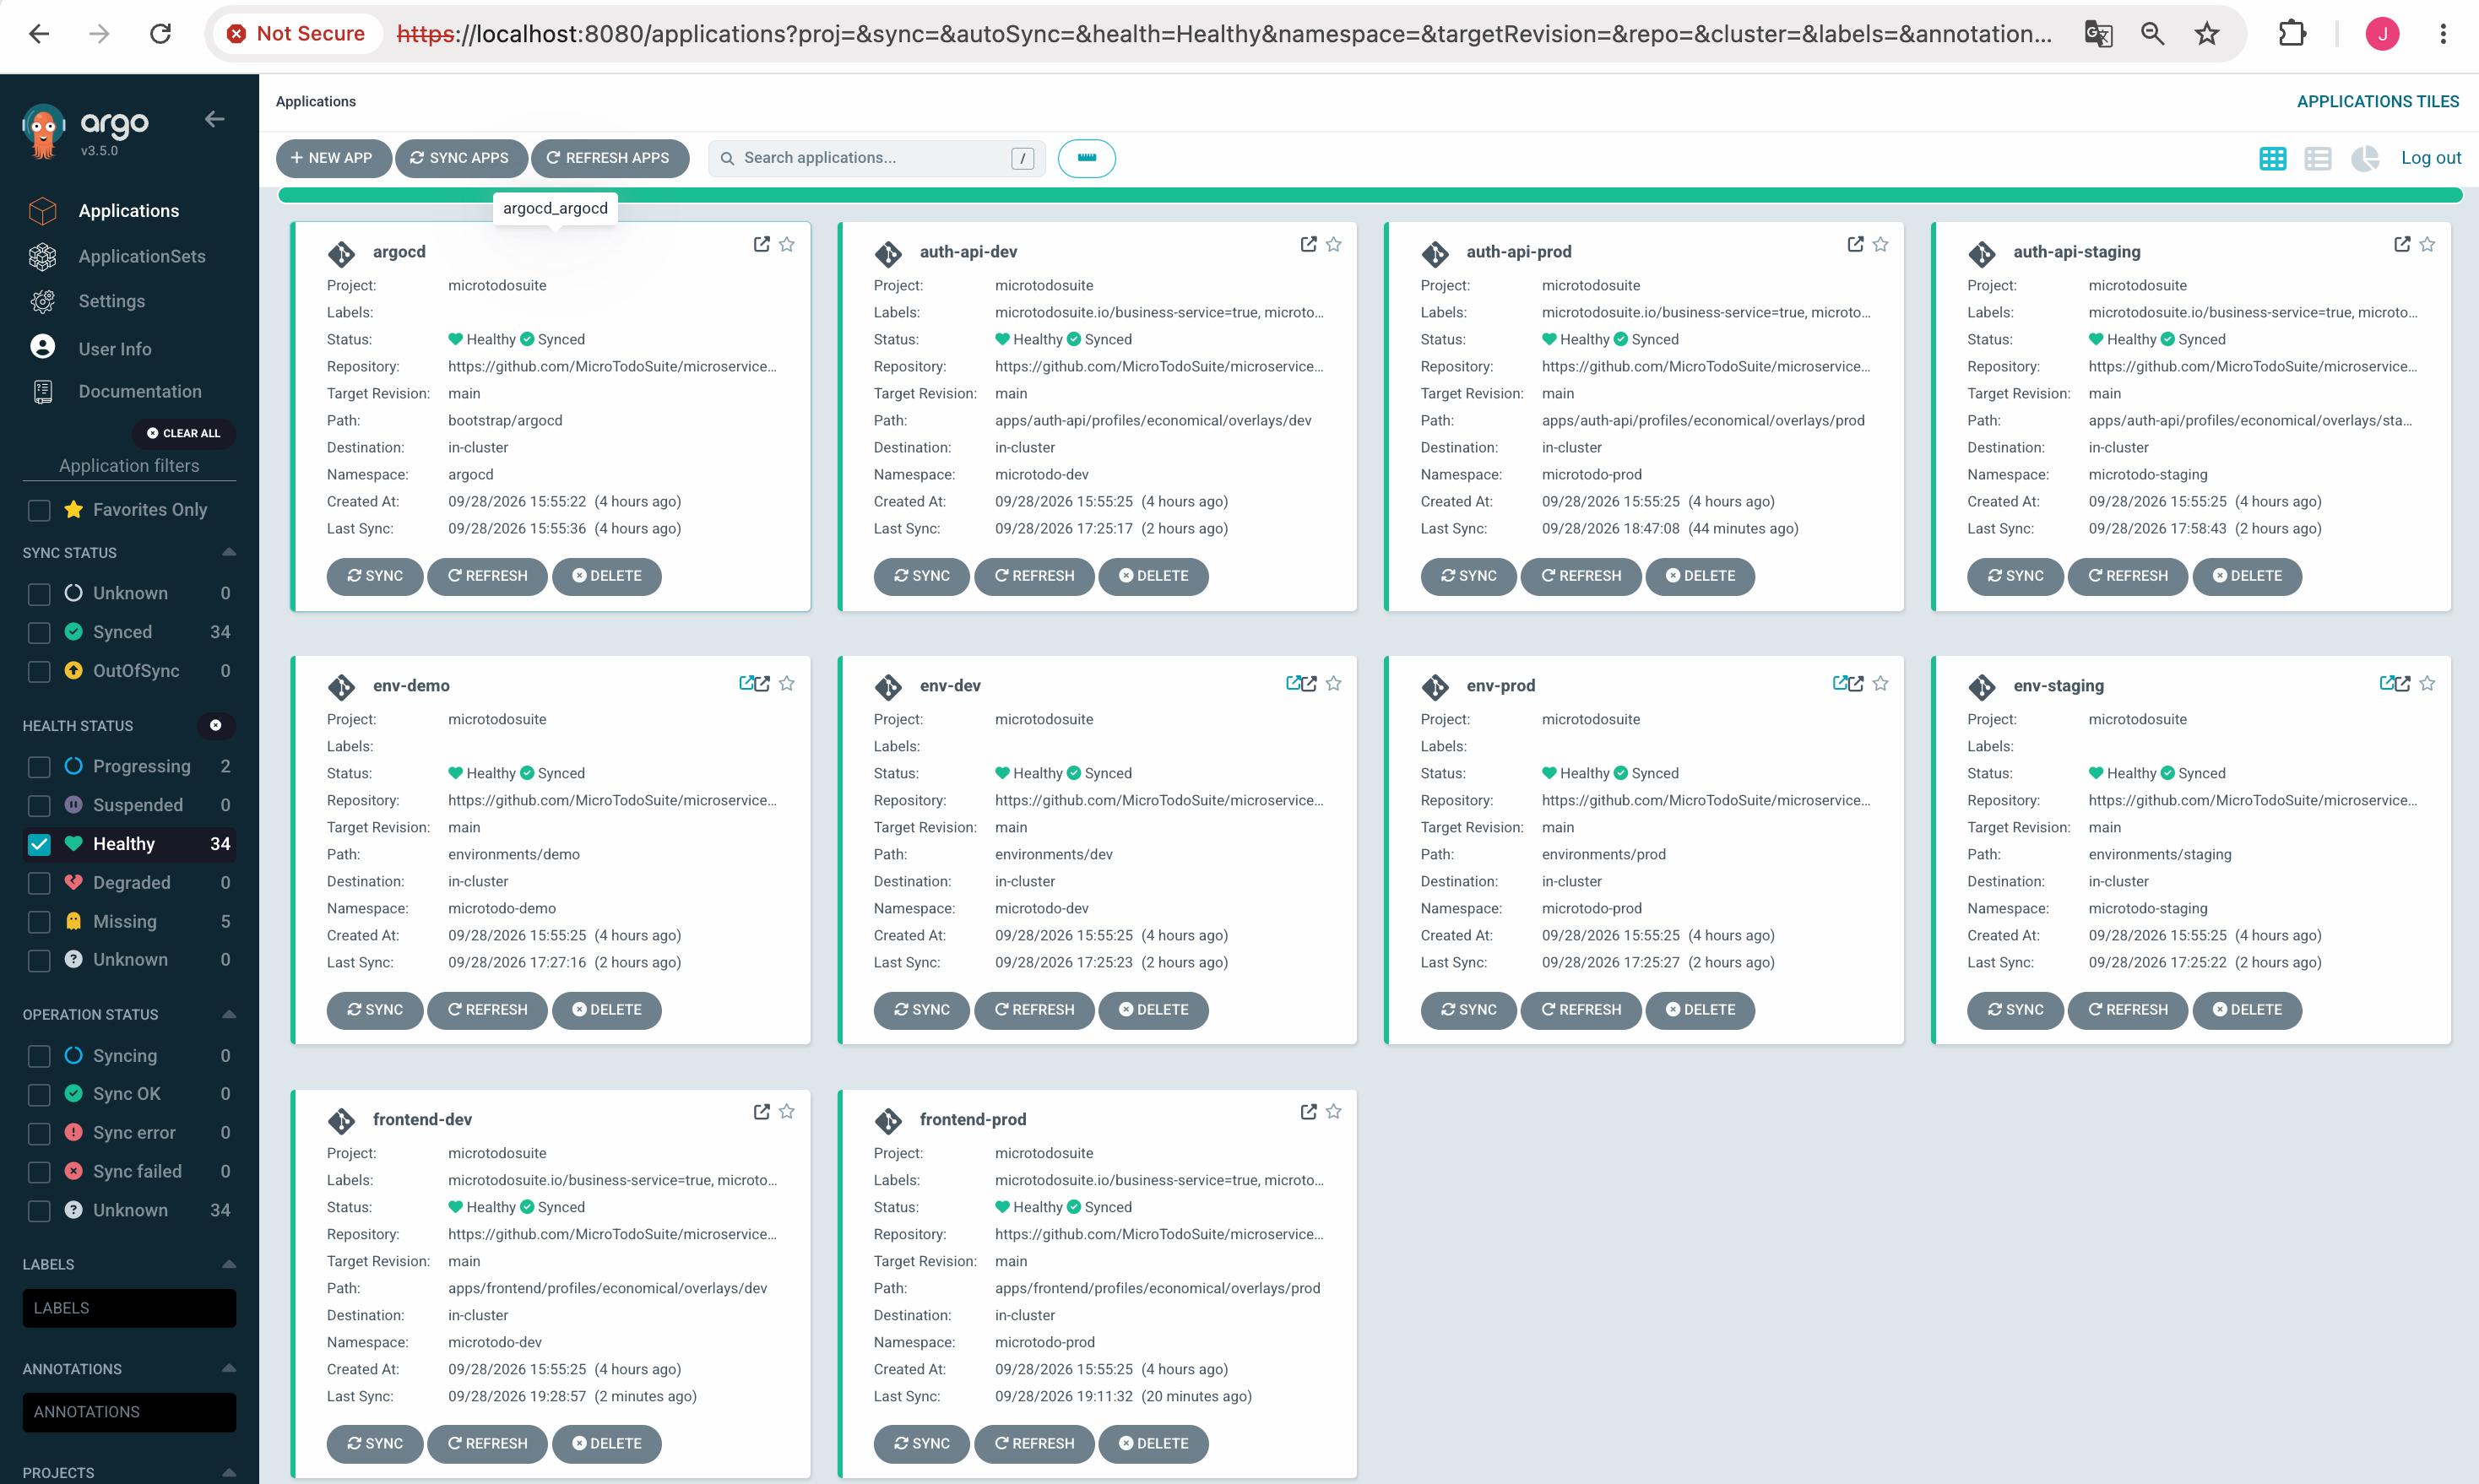
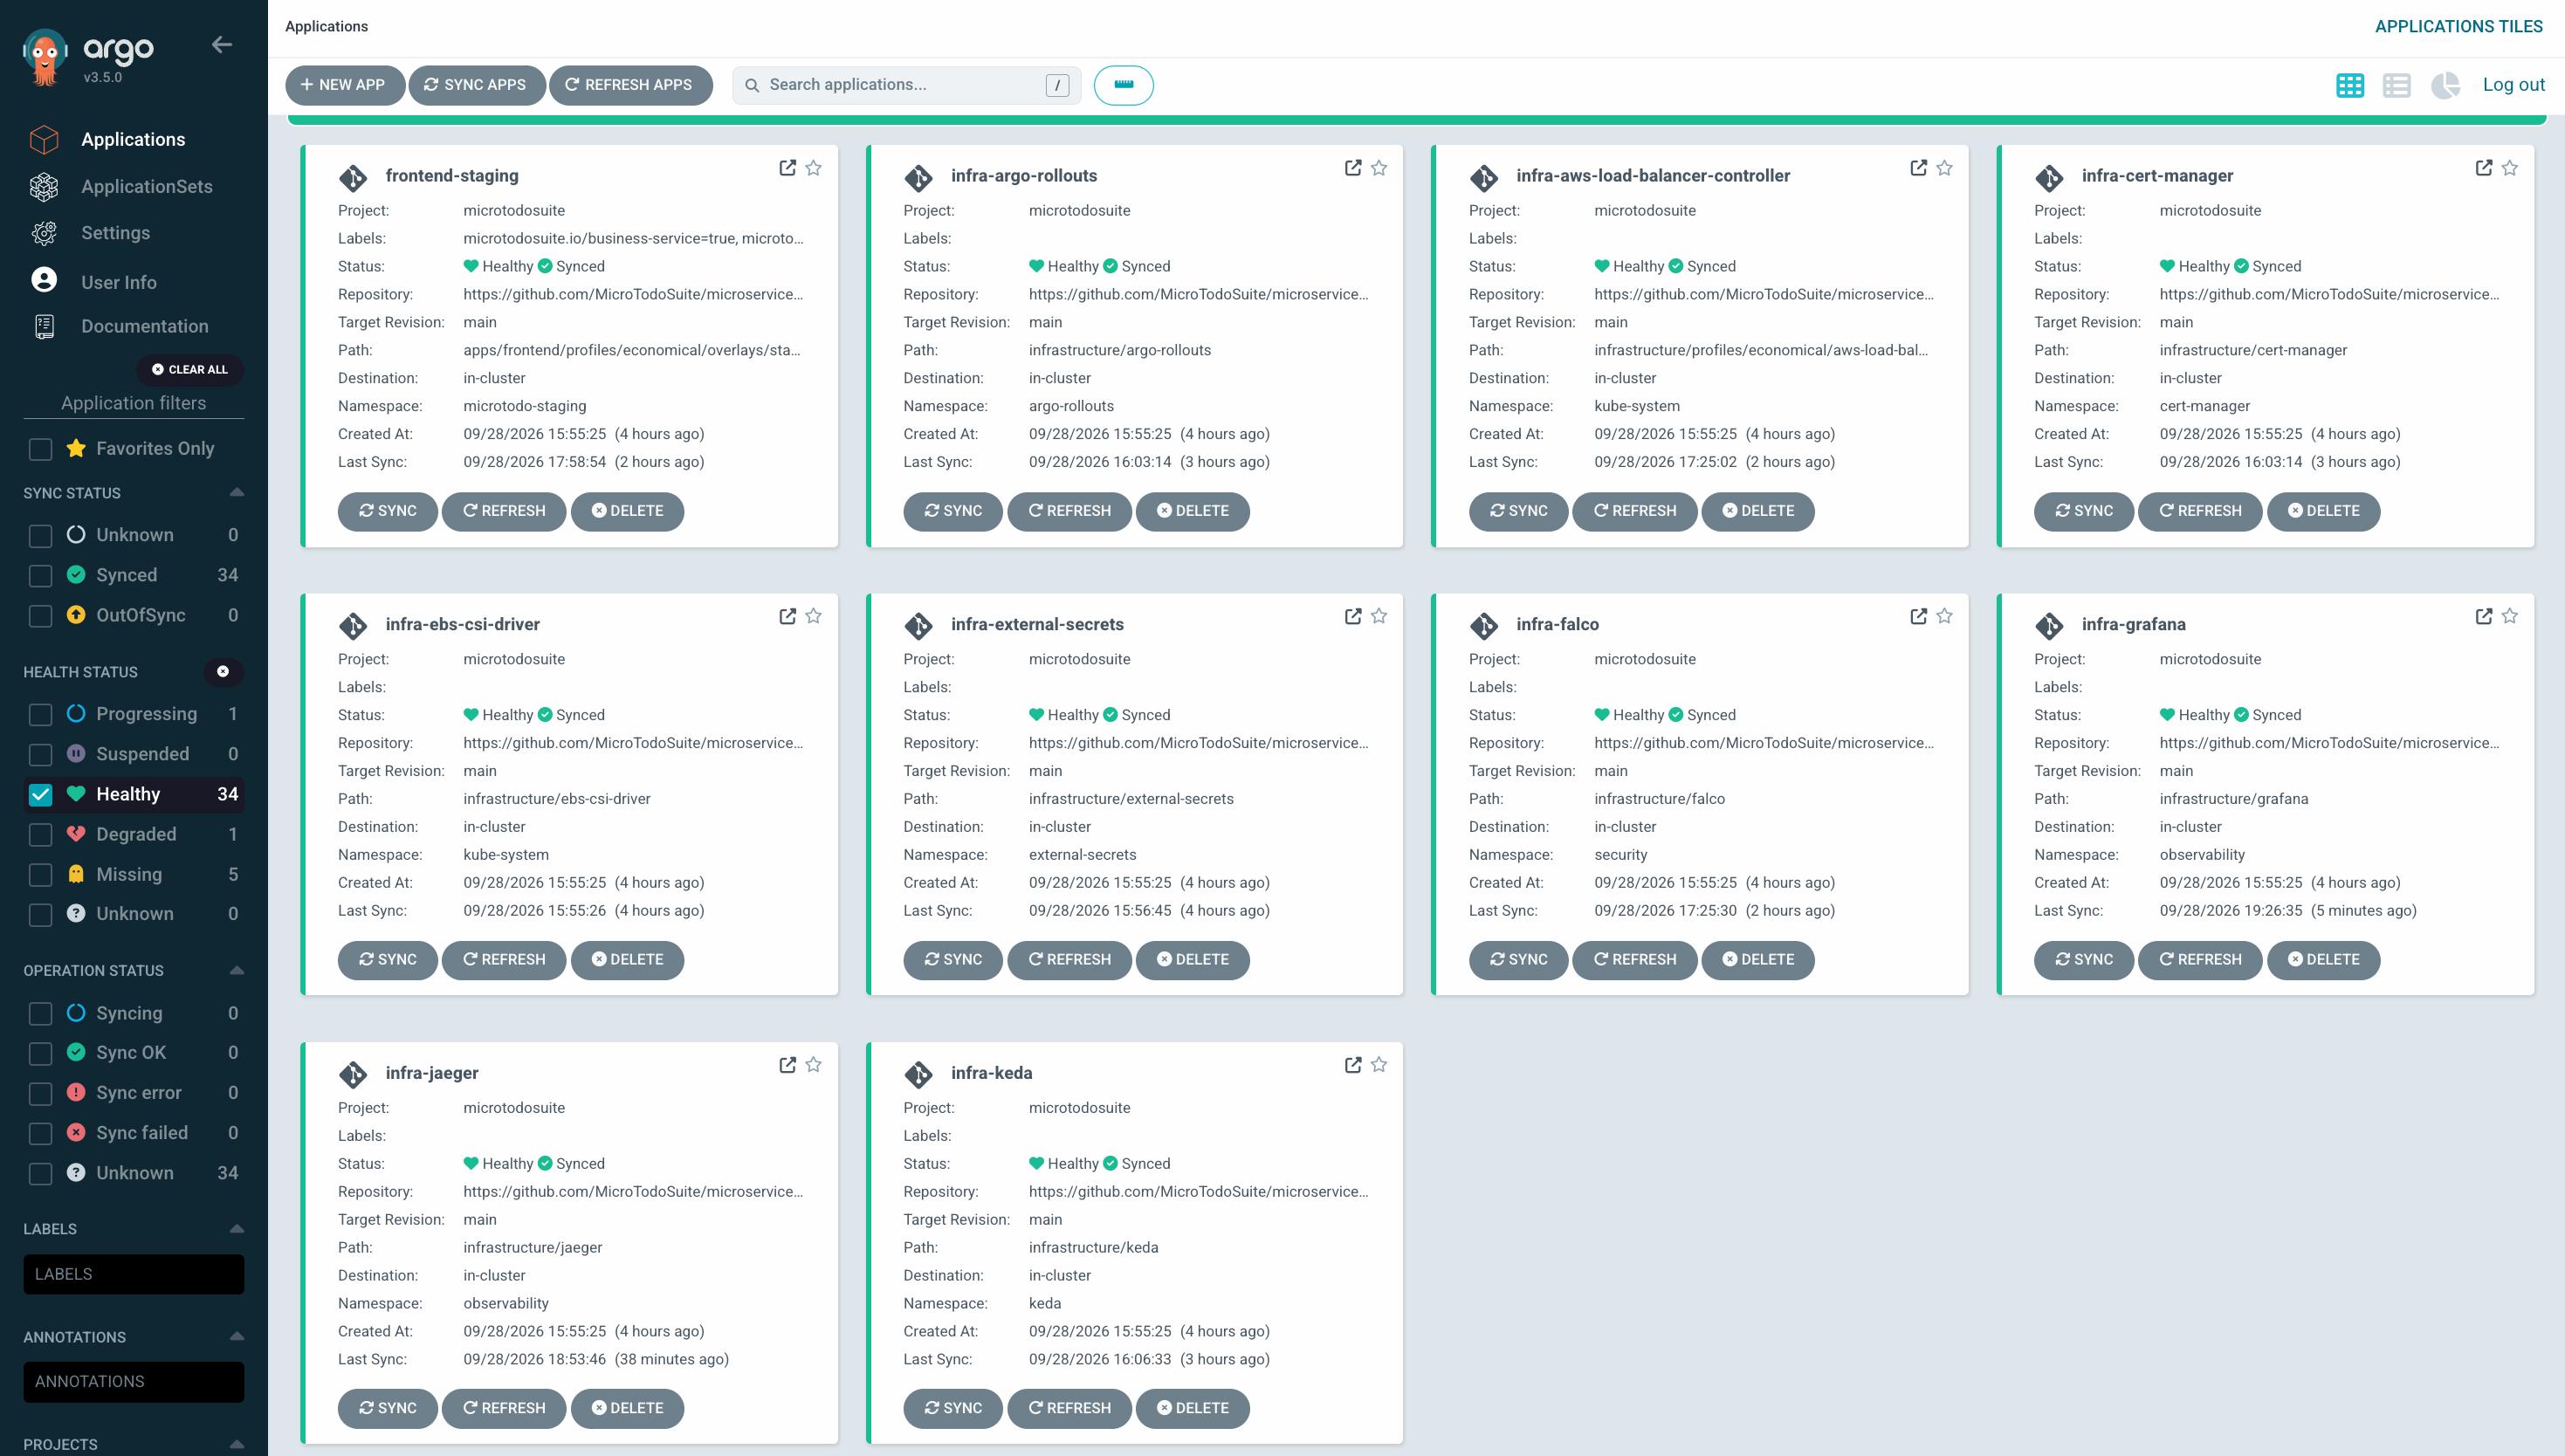
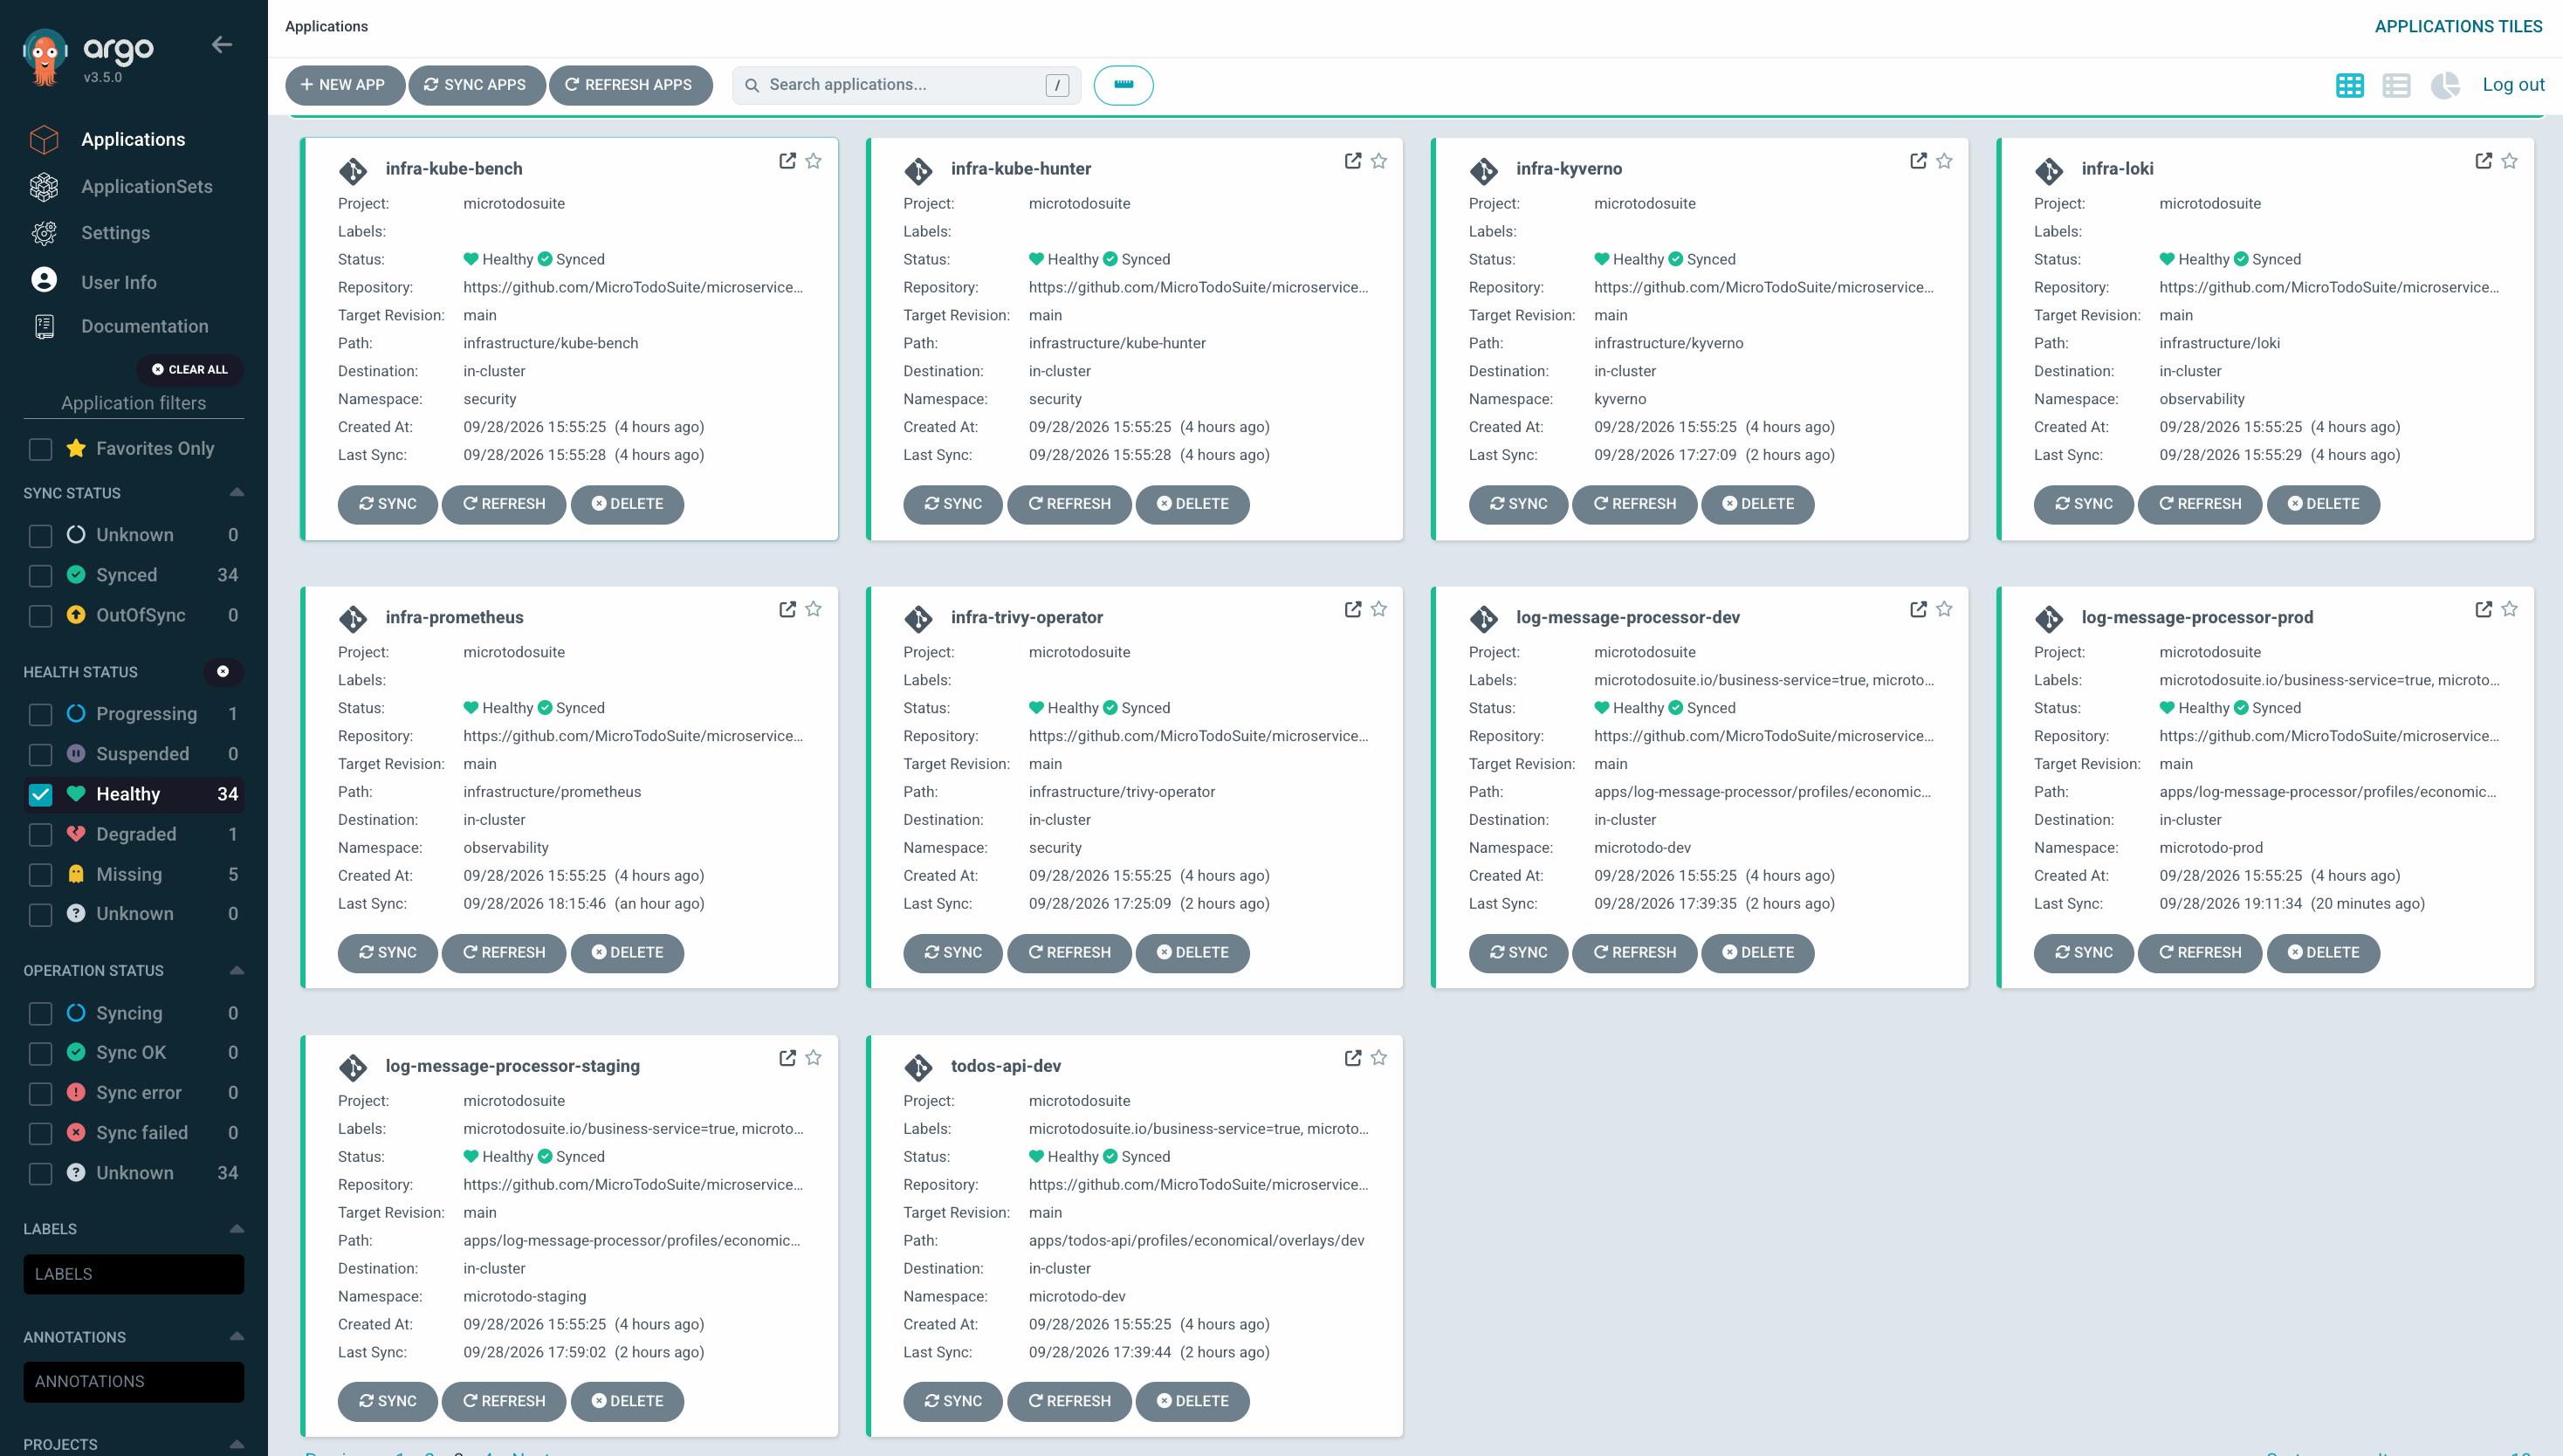
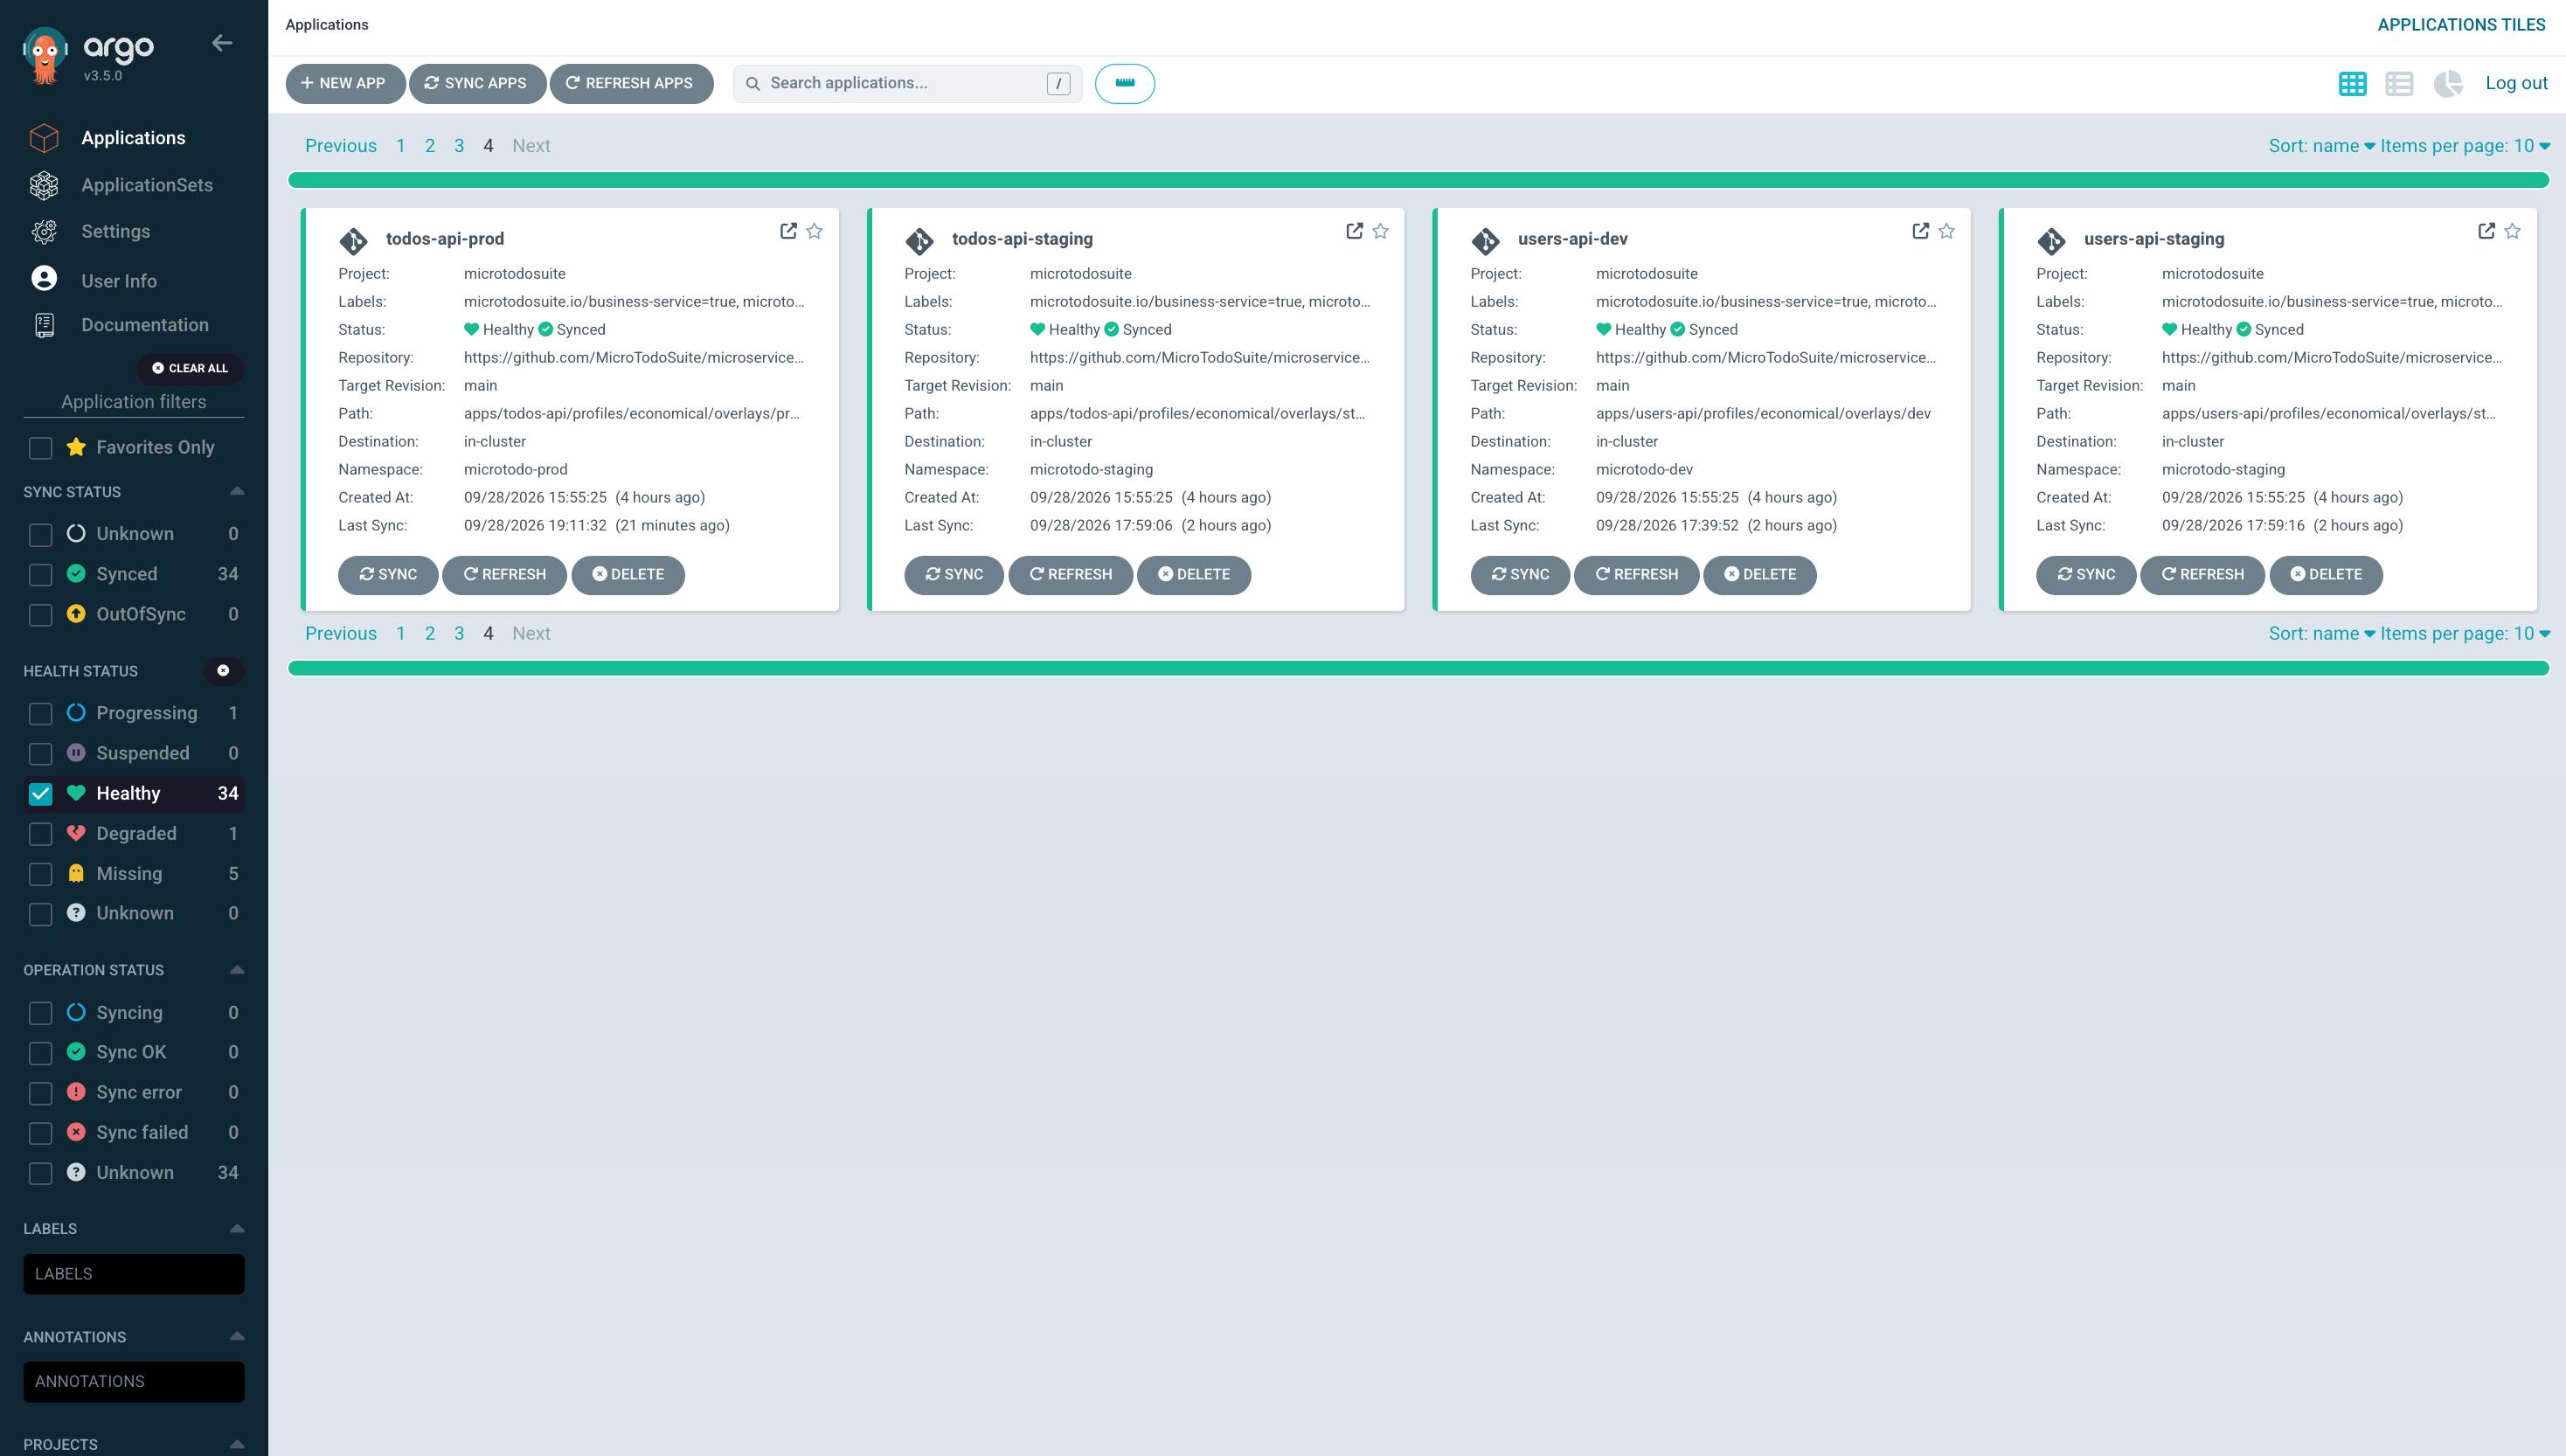
Evidence: every Application, Healthy

ArgoCD's own Applications view after the 2026-09-21 reactivation — every business and infrastructure Application the economical profile owns, filtered to Healthy.

ArgoCD Applications view filtered to Healthy: argocd, auth-api and frontend across dev/staging/prod/demo, all Healthy and Synced

The root argocd app-of-apps and the business services' four environments — 34 Applications reporting Healthy.

ArgoCD Applications view filtered to Healthy: infra-argo-rollouts, infra-cert-manager, infra-grafana, infra-keda and more, all Healthy and Synced

The infrastructure Applications ArgoCD reconciles on its own: Argo Rollouts, cert-manager, the AWS Load Balancer Controller, Grafana, KEDA.

ArgoCD Applications view filtered to Healthy: infra-kyverno, infra-loki, infra-prometheus, log-message-processor and todos-api environments, all Healthy and Synced

Kyverno, Loki, Prometheus and the Trivy Operator alongside log-message-processor and todos-api's own environments.

ArgoCD Applications view filtered to Healthy, last page: todos-api and users-api's remaining environments, all Healthy and Synced

The last page of the same filter — todos-api and users-api's remaining environments, closing out all 34.


The team behind the platform

Three engineers, three areas of ownership — infrastructure, observability and security, and CI/CD and delivery — coordinated through the same specifications this page describes.

Esteban Gaviria Zambrano

Esteban Gaviria Zambrano

Infrastructure

LinkedIn ↗
Santiago Valencia García

Santiago Valencia García

Observability & security

LinkedIn ↗
Juan Manuel Díaz Moreno

Juan Manuel Díaz Moreno

CI/CD & delivery

LinkedIn ↗